

Clinical Factors Associated with Lamina Cribrosa Thickness in Patients with Glaucoma, as Measured with Swept Source Optical Coherence Tomography
- PMID: 27100404
- PMCID: PMC4839731
- DOI: 10.1371/journal.pone.0153707
Clinical Factors Associated with Lamina Cribrosa Thickness in Patients with Glaucoma, as Measured with Swept Source Optical Coherence Tomography
Abstract
Purpose: To investigate the influence of various risk factors on thinning of the lamina cribrosa (LC), as measured with swept-source optical coherence tomography (SS-OCT; Topcon).
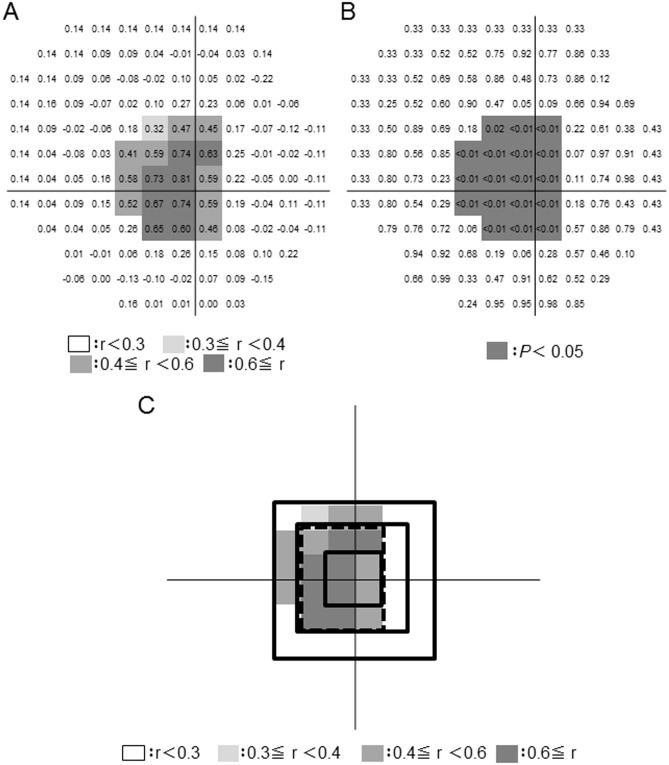
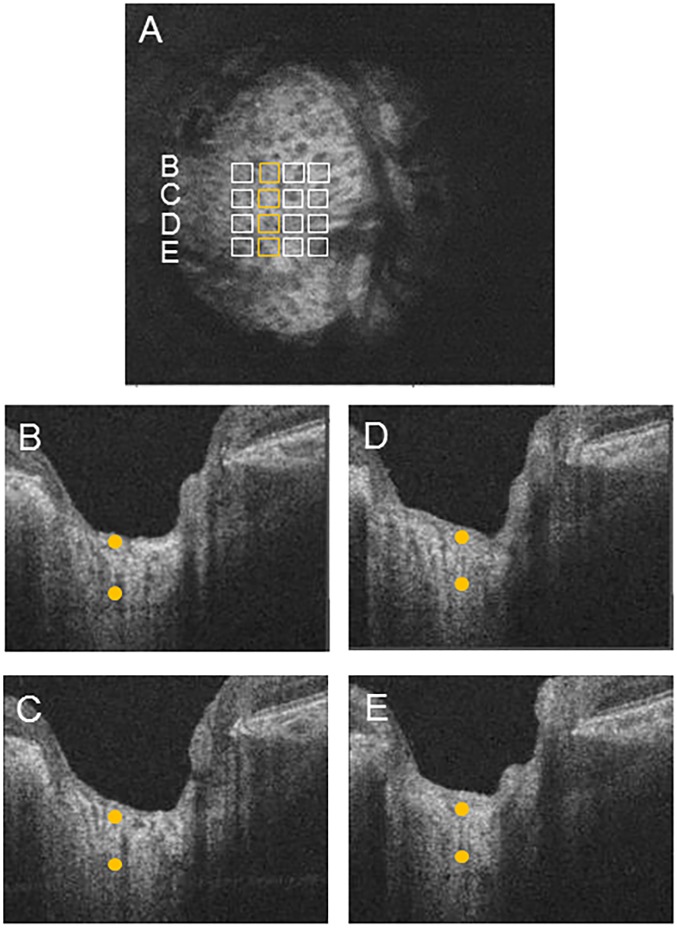
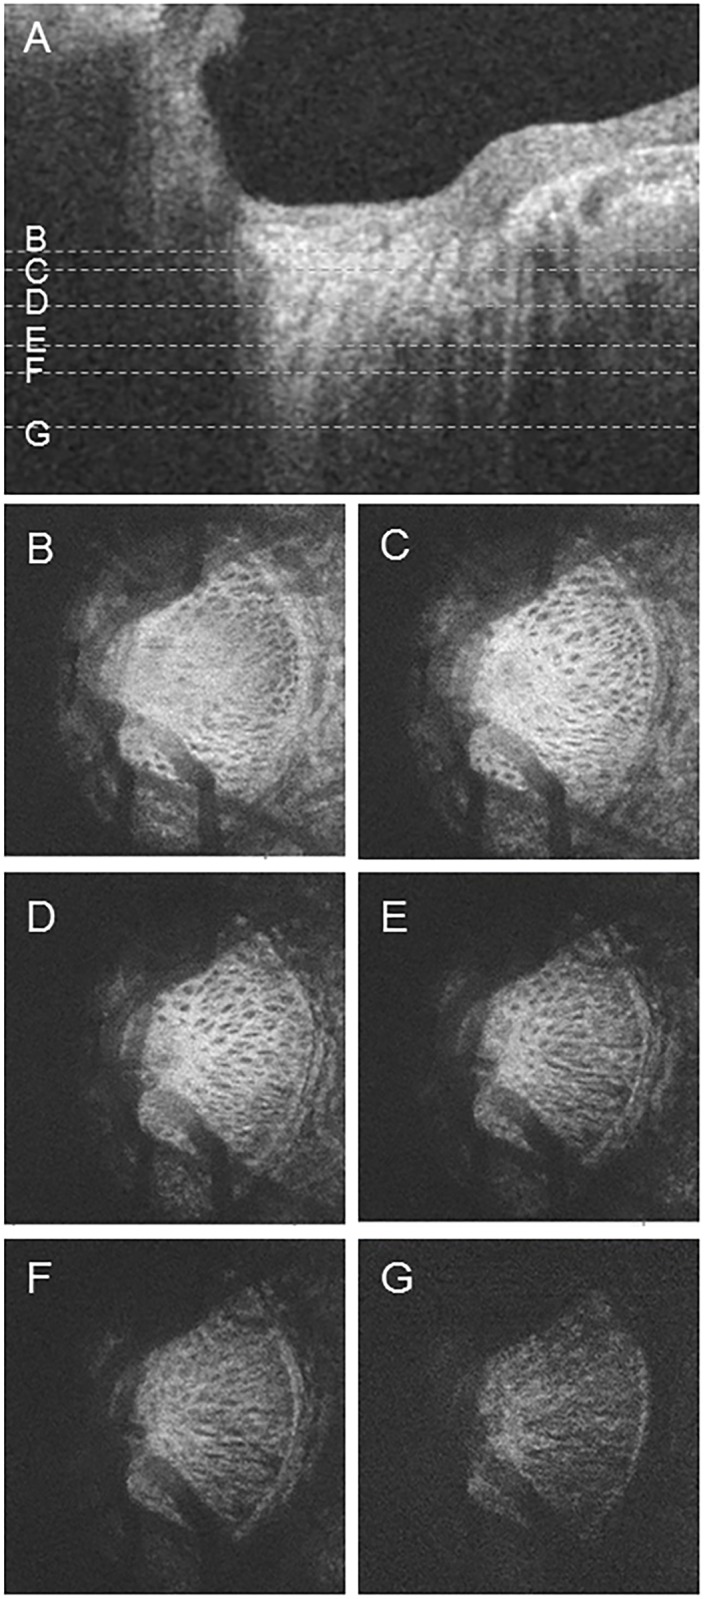
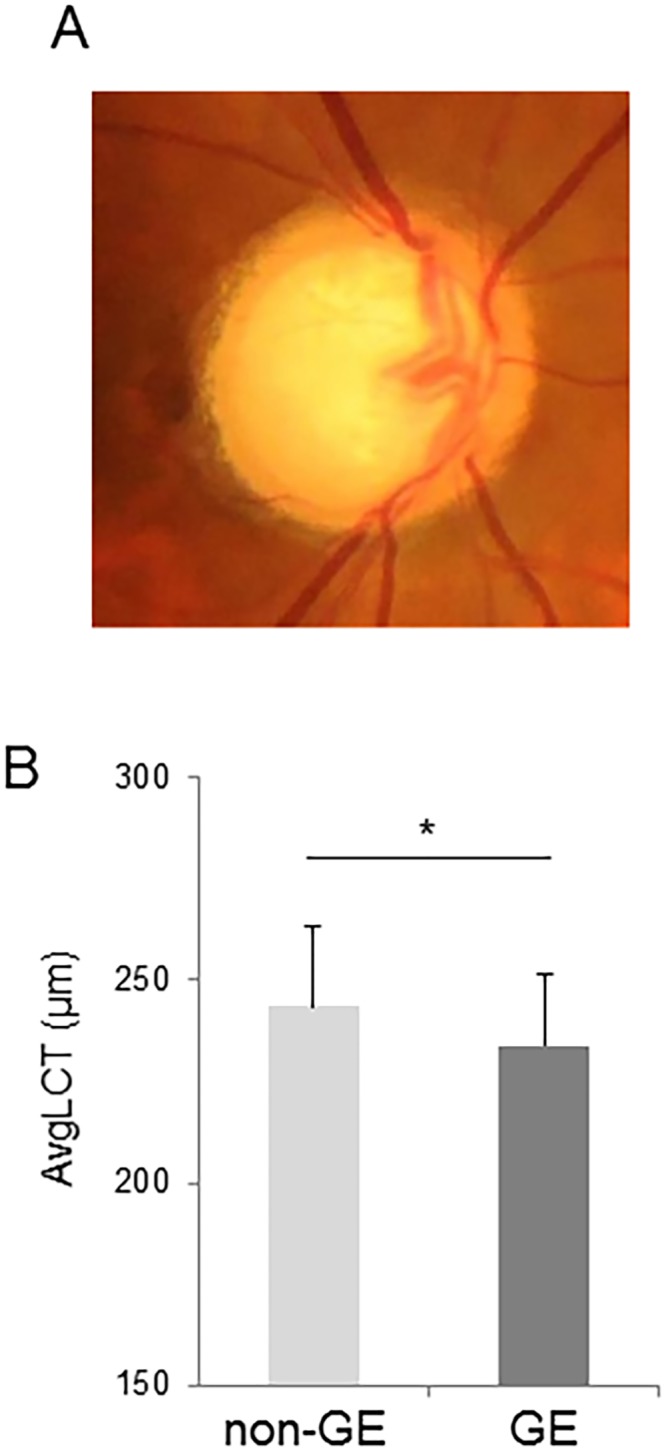
Methods: This retrospective study comprised 150 eyes of 150 patients: 22 normal subjects, 28 preperimetric glaucoma (PPG) patients, and 100 open-angle glaucoma patients. Average LC thickness was determined in a 3 x 3 mm cube scan of the optic disc, over which a 4 x 4 grid of 16 points was superimposed (interpoint distance: 175 μm), centered on the circular Bruch's membrane opening. The borders of the LC were defined as the visible limits of the LC pores. The correlation of LC thickness with Humphrey field analyzer-measured mean deviation (MD; SITA standard 24-2), circumpapillary retinal nerve fiber layer thickness (cpRNFLT), the vertical cup-to-disc (C/D) ratio, and tissue mean blur rate (MBR) was determined with Spearman's rank correlation coefficient. The relationship of LC thickness with age, axial length, intraocular pressure (IOP), MD, the vertical C/D ratio, central corneal thickness (CCT), and tissue MBR was determined with multiple regression analysis. Average LC thickness and the correlation between LC thickness and MD were compared in patients with the glaucomatous enlargement (GE) optic disc type and those with non-GE disc types, as classified with Nicolela's method.
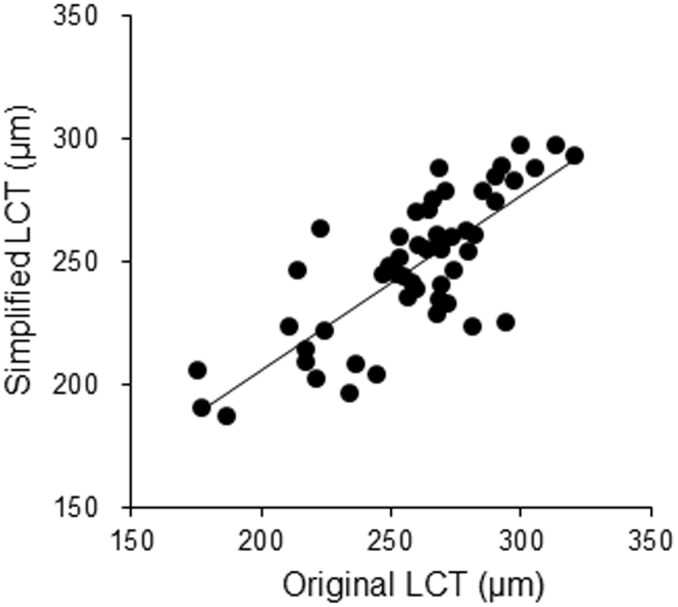
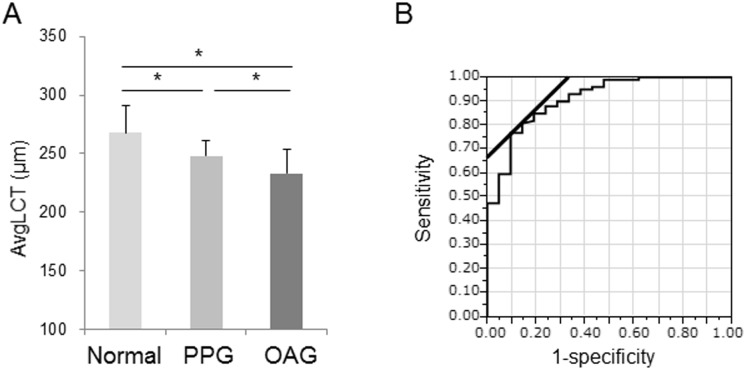
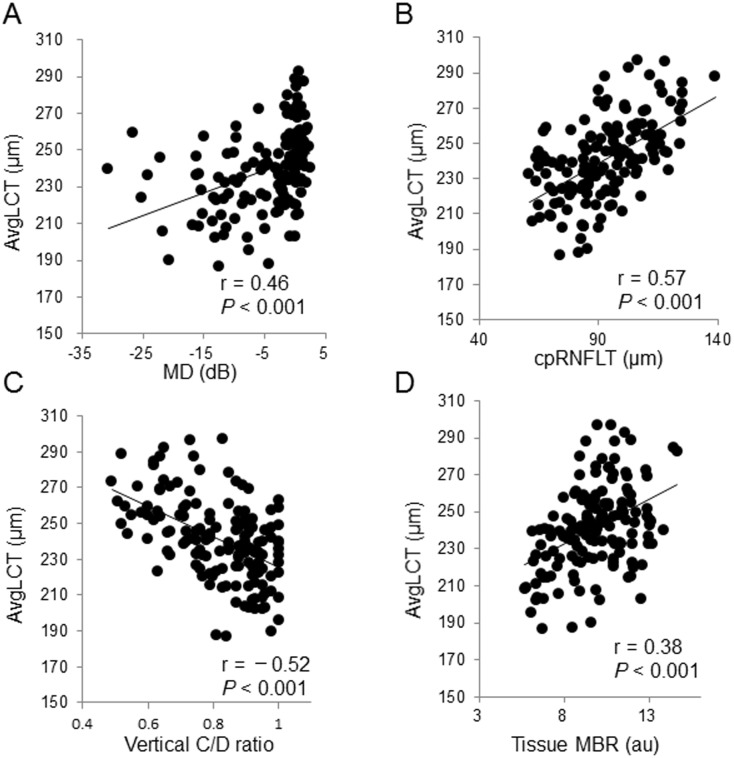
Results: We found that average LC thickness in the 16 grid points was significantly associated with overall LC thickness (r = 0.77, P < 0.001). The measurement time for this area was 12.4 ± 2.4 minutes. Average LC thickness in this area had a correlation coefficient of 0.57 with cpRNFLT (P < 0.001) and 0.46 (P < 0.001) with MD. Average LC thickness differed significantly between the groups (normal: 268 ± 23 μm, PPG: 248 ± 13 μm, OAG: 233 ± 20 μm). Multiple regression analysis showed that MD (β = 0.29, P = 0.013), vertical C/D ratio (β = -0.25, P = 0.020) and tissue MBR (β = 0.20, P = 0.034) were independent variables significantly affecting LC thickness, but age, axial length, IOP, and CCT were not. LC thickness was significantly lower in the GE patients (233.9 ± 17.3 μm) than the non-GE patients (243.6 ± 19.5 μm, P = 0.040). The correlation coefficient between MD and LC thickness was 0.58 (P < 0.001) in the GE patients and 0.39 (P = 0.013) in the non-GE patients.
Conclusion: Cupping formation and tissue blood flow were independently correlated to LC thinning. Glaucoma patients with the GE disc type, who predominantly have large cupping, had lower LC thickness even with similar glaucoma severity.
Conflict of interest statement
Figures
Similar articles
-
3D evaluation of the lamina cribrosa with swept-source optical coherence tomography in normal tension glaucoma.PLoS One. 2015 Apr 15;10(4):e0122347. doi: 10.1371/journal.pone.0122347. eCollection 2015. PLoS One. 2015. PMID: 25875096 Free PMC article.
-
Alterations in the neural and connective tissue components of glaucomatous cupping after glaucoma surgery using swept-source optical coherence tomography.Invest Ophthalmol Vis Sci. 2014 Jan 23;55(1):477-84. doi: 10.1167/iovs.13-11897. Invest Ophthalmol Vis Sci. 2014. PMID: 24398100
-
OCT-Based Quantification and Classification of Optic Disc Structure in Glaucoma Patients.PLoS One. 2016 Aug 24;11(8):e0160226. doi: 10.1371/journal.pone.0160226. eCollection 2016. PLoS One. 2016. PMID: 27557112 Free PMC article.
-
[Aiming for zero blindness].Nippon Ganka Gakkai Zasshi. 2015 Mar;119(3):168-93; discussion 194. Nippon Ganka Gakkai Zasshi. 2015. PMID: 25854109 Review. Japanese.
-
Elucidation of the role of the lamina cribrosa in glaucoma using optical coherence tomography.Surv Ophthalmol. 2022 Jan-Feb;67(1):197-216. doi: 10.1016/j.survophthal.2021.01.015. Epub 2021 Feb 3. Surv Ophthalmol. 2022. PMID: 33548238 Review.
Cited by
-
Predicting the development of normal tension glaucoma and related risk factors in normal tension glaucoma suspects.Sci Rep. 2021 Aug 17;11(1):16697. doi: 10.1038/s41598-021-95984-7. Sci Rep. 2021. PMID: 34404847 Free PMC article.
-
The Future of Imaging in Detecting Glaucoma Progression.Ophthalmology. 2017 Dec;124(12S):S76-S82. doi: 10.1016/j.ophtha.2017.10.011. Ophthalmology. 2017. PMID: 29157365 Free PMC article. Review.
-
Changes in Optic Nerve Head Blood Flow During Horizontal Ocular Duction.Invest Ophthalmol Vis Sci. 2024 Jan 2;65(1):7. doi: 10.1167/iovs.65.1.7. Invest Ophthalmol Vis Sci. 2024. PMID: 38170537 Free PMC article.
-
Color visual acuity in preperimetric glaucoma and open-angle glaucoma.PLoS One. 2019 Apr 17;14(4):e0215290. doi: 10.1371/journal.pone.0215290. eCollection 2019. PLoS One. 2019. PMID: 30995280 Free PMC article. Clinical Trial.
-
Pilot study for three-dimensional assessment of laminar pore structure in patients with glaucoma, as measured with swept source optical coherence tomography.PLoS One. 2018 Nov 21;13(11):e0207600. doi: 10.1371/journal.pone.0207600. eCollection 2018. PLoS One. 2018. PMID: 30462712 Free PMC article.
References
-
- Leske MC, Heijl A, Hyman L, Bengtsson B, Dong L, Yang Z, et al. Predictors of long-term progression in the early manifest glaucoma trial. Ophthalmology. 2007;114: 1965–1972. - PubMed
-
- Suzuki Y, Iwase A, Araie M, Yamamoto T, Abe H, Shirato S, et al. Risk factors for open-angle glaucoma in a Japanese population: the Tajimi Study. Ophthalmology. 2006;113: 1613–1617. - PubMed
-
- Tielsch JM, Katz J, Sommer A, Quigley HA, Javitt JC. Family history and risk of primary open angle glaucoma. The Baltimore Eye Survey. Arch Ophthalmol. 1994;112: 69–73. - PubMed
Publication types
MeSH terms
LinkOut - more resources
Full Text Sources
Other Literature Sources
Medical
