. 2016 Apr 21;11(4):e0153718.
doi: 10.1371/journal.pone.0153718. eCollection 2016.

PBRM1 Regulates the Expression of Genes Involved in Metabolism and Cell Adhesion in Renal Clear Cell Carcinoma

Affiliations

PBRM1 Regulates the Expression of Genes Involved in Metabolism and Cell Adhesion in Renal Clear Cell Carcinoma

Basudev Chowdhury et al. PLoS One. .

Abstract

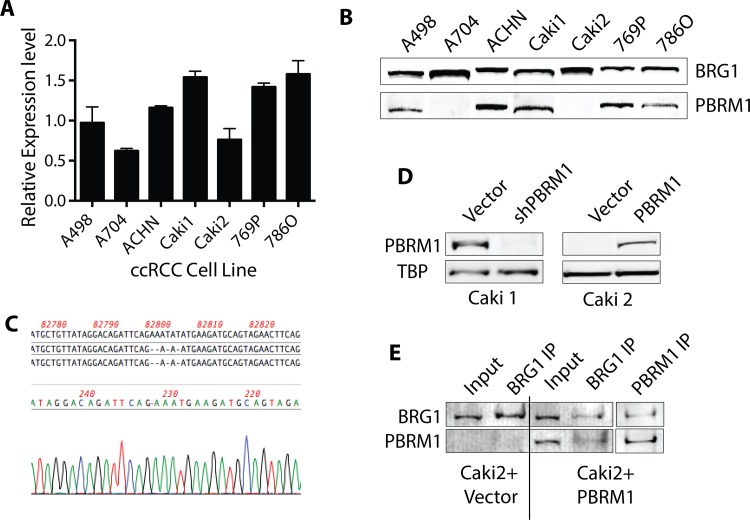
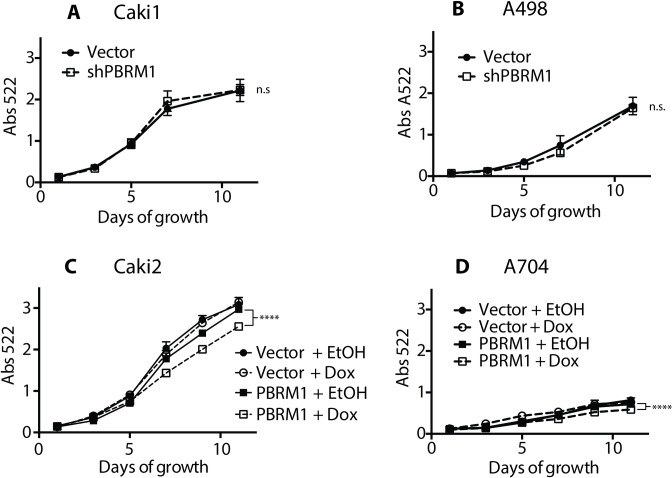
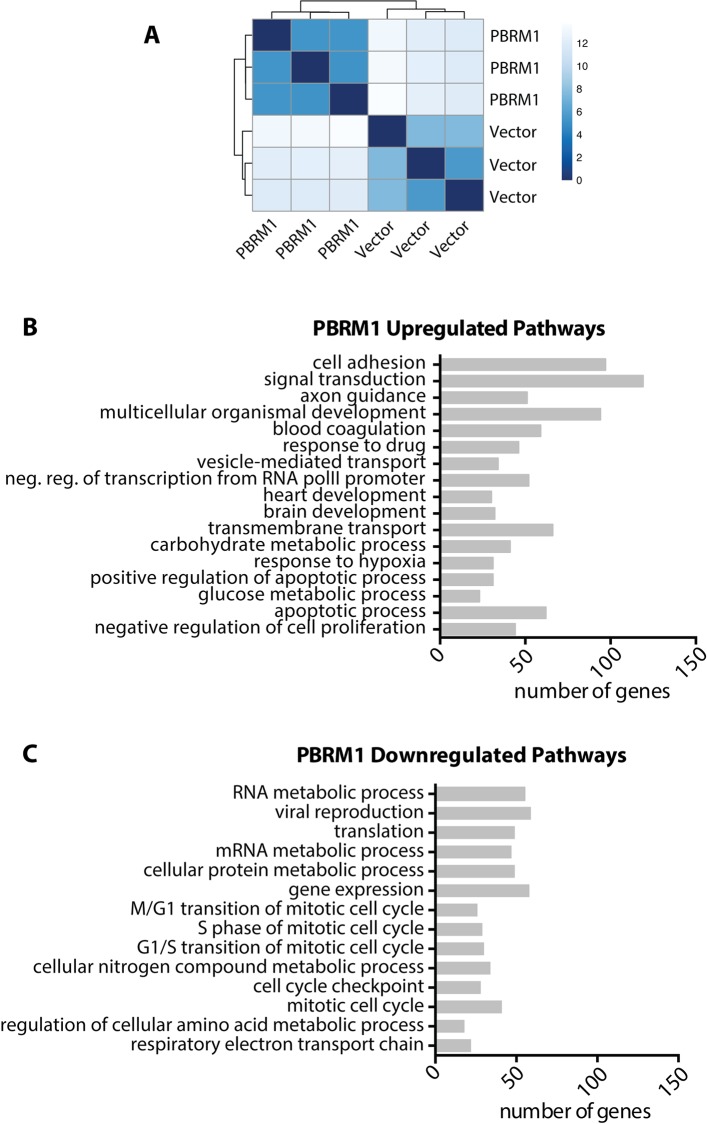
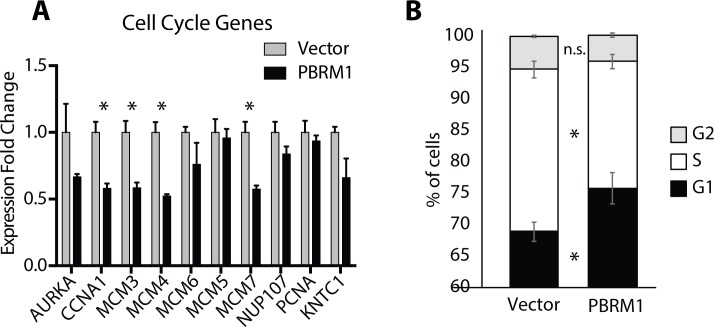
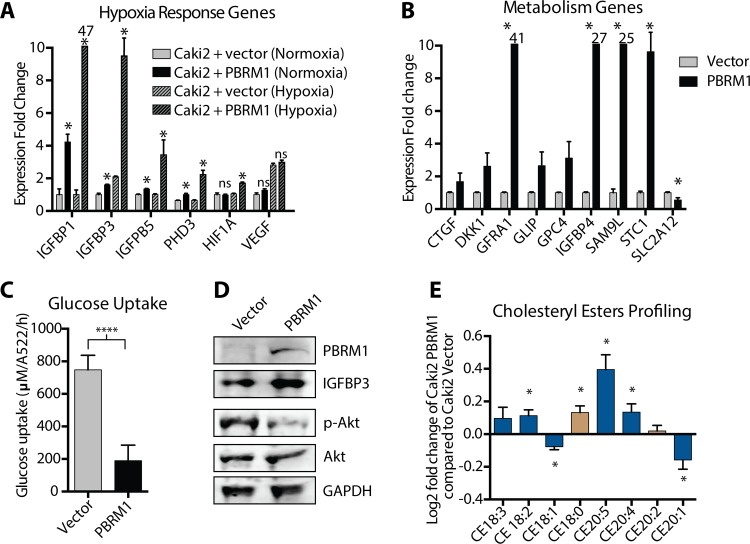
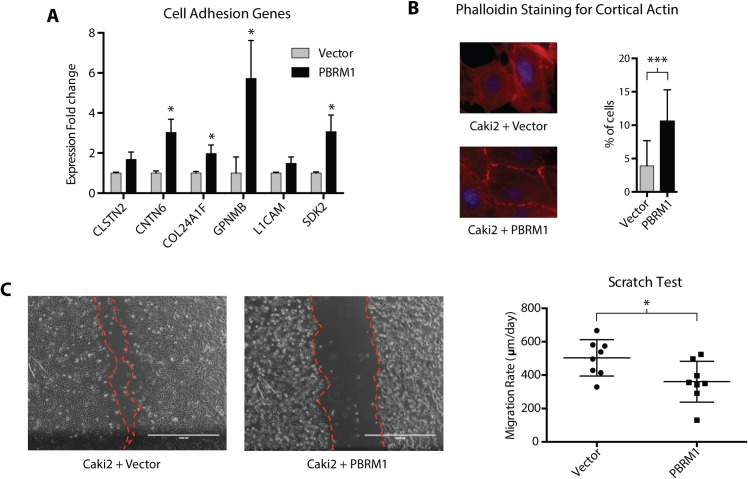
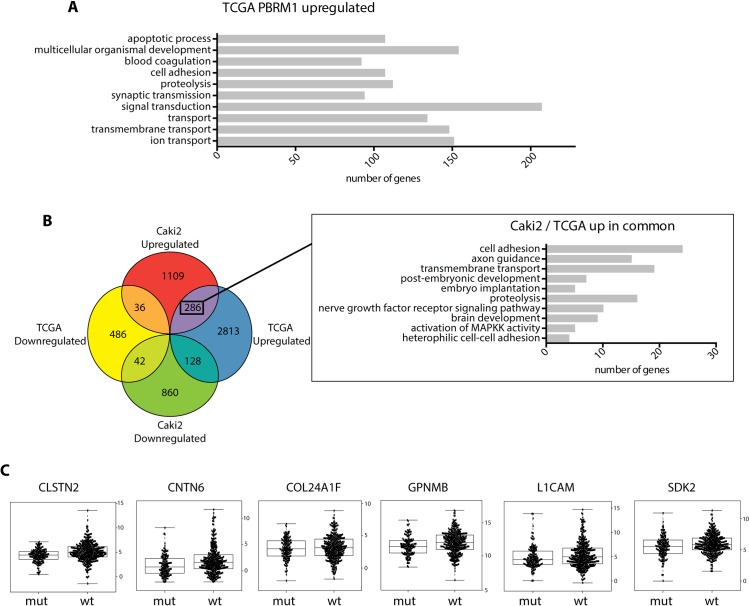
Polybromo-1 (PBRM1) is a component of the PBAF (Polybromo-associated-BRG1- or BRM-associated factors) chromatin remodeling complex and is the second most frequently mutated gene in clear-cell renal cell Carcinoma (ccRCC). Mutation of PBRM1 is believed to be an early event in carcinogenesis, however its function as a tumor suppressor is not understood. In this study, we have employed Next Generation Sequencing to profile the differentially expressed genes upon PBRM1 re-expression in a cellular model of ccRCC. PBRM1 re-expression led to upregulation of genes involved in cellular adhesion, carbohydrate metabolism, apoptotic process and response to hypoxia, and a downregulation of genes involved in different stages of cell division. The decrease in cellular proliferation upon PBRM1 re-expression was confirmed, validating the functional role of PBRM1 as a tumor suppressor in a cell-based model. In addition, we identified a role for PBRM1 in regulating metabolic pathways known to be important for driving ccRCC, including the regulation of hypoxia response genes, PI3K signaling, glucose uptake, and cholesterol homeostasis. Of particular novelty is the identification of cell adhesion as a major downstream process uniquely regulated by PBRM1 expression. Cytoskeletal reorganization was induced upon PBRM1 reexpression as evidenced from the increase in the number of cells displaying cortical actin, a hallmark of epithelial cells. Genes involved in cell adhesion featured prominently in our transcriptional dataset and overlapped with genes uniquely regulated by PBRM1 in clinical specimens of ccRCC. Genes involved in cell adhesion serve as tumor suppressor and maybe involved in inhibiting cell migration. Here we report for the first time genes linked to cell adhesion serve as downstream targets of PBRM1, and hope to lay the foundation of future studies focusing on the role of chromatin remodelers in bringing about these alterations during malignancies.


Conflict of interest statement

Competing Interests: The authors have declared that no competing interests exist.

Figures

Fig 1
Fig 1. Characterization of PBRM1 in ccRCC cells.
(A) Relative transcript expression of PBRM1 in ccRCC cell lines. (B) Protein levels of BRG1 and PBRM1 in ccRCC cell lines. (C) Characterization of deletion in exon 17 of PBRM1 gene in Caki2 cells. (D) Protein levels of PBRM1 in isogenic ccRCC cells (Caki1 with PBRM1 knockdown and Caki2 with PBRM1 re-expression). (D) BRG1 and PBRM1 blotting in BRG1 or PBRM1 immunoprecipitates of Caki2+Vector and Caki2+PBRM1.
Fig 2
Fig 2. Presence of PBRM1 resulted in decreased proliferation rate of ccRCC cells.
Cellular proliferation rate was monitored in (A) Caki1 and (B) A498 with either control knockdown or PBRM1 knockdown, as well as (C) Caki2 and (D) A704 with either control vectors or PBRM1 re-expression vectors. Both cell lines were treated with ethanol or doxycycline to control for cell line variation or doxycycline effects. n = 8 independent biological replicate experiments. P < 0.0001 (****) (two-way ANOVA test) between PBRM1 re-expression cell lines treated with ethanol (EtOH) or Doxycycline (Dox) at day 11. Error bars represent s.e.m.
Fig 3
Fig 3. Summary of differentially expressed genes in Caki2 cells upon PBRM1 reexpression.
(A) Hierarchical Cluster Dendrogram of Caki2+Vector and Caki2+PBRM1 samples sequenced. (B) GO Biological Processes enriched by genes upregulated upon PBRM1 reexpression. (C) GO Biological Processes enriched by genes downregulated upon PBRM1 reexpression.
Fig 4
Fig 4. Downregulation of genes involved in cell proliferation upon PBRM1 re-expression.
(A) Validating relative expression of genes regulating cell cycle (identified in RNA_seq data) in Caki2+Vectorand Caki2+PBRM1 cells by qRTPCR. A designation of * = P < 0.05 (paired Student t-test). n = 3 independent biological replicate experiments. Error bars represent s.e.m. (B) Percentage of cells in different stages of cell cycle (G1, S and G2) determined by flow cytometric analysis. A designation of * = P < 0.05 (paired Student t-test). n = 3 independent biological replicate experiments. Error bars represent s.e.m.
Fig 5
Fig 5. Alteration of metabolism upon PBRM1 re-expression.
(A) Relative expression of genes regulating hypoxic response in Caki2+Vectorand Caki2+PBRM1 cells subjected to normoxic and hypoxic (0.5% O2) conditions. A designation of * indicates p < 0.05 (Student t-test). n = 3 independent biological replicate experiments. Error bars represent s.e.m. (B) Validating relative expression of genes regulating primary metabolic processes (identified in RNA_seq data) in Caki2+Vectorand Caki2+PBRM1 cells by qRTPCR. (C) Determination of glucose uptake in Caki2+Vectorand Caki2+PBRM1 cells. A designation of **** indicates p < 0.0001 (paired Student t-test). n = 5 independent biological replicate experiments. Error bars represent s.e.m. (D) Immunoblot of IGFBP3, phosphorylated AKT and unphosphorylated AKT in Caki2+Vectorand Caki2+PBRM1 cells. (E) Semi-quantitative estimation of alteration of cholesteryl esters in Caki2+PBRM1 compared to Caki2-Ø. Bars depicted in blue reverse the differences observed during the progression from normal kidney epithelium to ccRCC and bars depicted in tan compound those differences. A designation of * = P < 0.05 (paired Student t-test). n = 3 independent biological replicate experiments. Error bars represent s.e.m.
Fig 6
Fig 6. Alteration of cell-cell adhesion upon PBRM1-reexpression.
(A) Validating relative expression of genes regulating cell-cell adhesion (identified in RNA_seq data) in Caki2+Vectorand Caki2+PBRM1 cells by qRTPCR. A designation of * indicates p < 0.05 (Student t-test). n = 3 independent biological replicate experiments. Error bars represent s.e.m. (B) Phalloidin staining of F actin (red channel) and DAPI staining of nucleus (blue channel) in Caki2+Vectorand Caki2+PBRM1 cells. A designation of *** indicates p < 0.001 (Fisher’s exact t-test). n = 5 independent biological replicate experiments. Error bars represent s.e.m. (C) In vitro scratch assay illustrating cell migration 24 hours after scratch wound inflection. A designation of * indicates p < 0.05 (Student t-test). n = 8 independent biological replicate experiments. Error bars represent s.e.m.
Fig 7
Fig 7. Comparative analysis of genes with differential expression in the presence of PBRM1 between ccRCC cells and ccRCC TCGA biospecimen.
(A) GO Biological Processes enriched by genes upregulated in TCGA ccRCC biospecimen with no PBRM1 mutation compared to ccRCC biospecimen with PBRM1 mutations. (B)Venn diagram illustrating the number of differentially expressed genes overlapping between the 2 datasets (Genes with differential expression in 1. Caki2+PBRM1 with respect to Caki2+Vector and 2. ccRCC biospecimen with no PBRM1 mutation with respect to biospecimen with PBRM1 mutations). Inset illustrates GO Biological Processes enriched by upregulated genes in both (1) PBRM1 reexpressed Caki2 cells and (2) TCGA ccRCC biospecimen with no PBRM1 mutation. (C) Box Plot showing the relative expression (log2 RSEM) of genes involved in cell adhesion in TCGA biospecimen.

References

    1. Brugarolas J. Molecular genetics of clear- cell renal cell carcinoma. Journal Of Clinical Oncology: Official Journal Of The American Society Of Clinical Oncology. 2014;32(18):1968 10.1200/JCO.2012.45.2003 - DOI - PMC - PubMed
    1. Cairns P. Renal cell carcinoma. Cancer biomarkers: section A of Disease markers. 2010;9(1–6):461 10.3233/CBM-2011-0176 - DOI - PMC - PubMed
    1. Motzer RJ, Jonasch E, Agarwal N, Beard C, Bhayani S, Bolger GB, et al. Kidney cancer, version 3.2015. Journal Of The National Comprehensive Cancer Network: JNCCN. 2015;13(2):151 - PubMed
    1. Lucy G, Tim E, Eamonn RM. VHL, the story of a tumour suppressor gene. Nature Reviews Cancer. 2014;15(1):55 10.1038/nrc3844 - DOI - PubMed
    1. Duns G, Hofstra RM, Sietzema JG, Hollema H, van Duivenbode I, Kuik A, et al. Targeted exome sequencing in clear cell renal cell carcinoma tumors suggests aberrant chromatin regulation as a crucial step in ccRCC development. Hum Mutat. 2012;33(7):1059–62. Epub 2012/03/31. 10.1002/humu.22090 . - DOI - PubMed

Publication types

MeSH terms

Associated data