. 2016 Apr 21;11(4):e0153727.
doi: 10.1371/journal.pone.0153727. eCollection 2016.

A Balanced Tissue Composition Reveals New Metabolic and Gene Expression Markers in Prostate Cancer

Affiliations

A Balanced Tissue Composition Reveals New Metabolic and Gene Expression Markers in Prostate Cancer

May-Britt Tessem et al. PLoS One. .

Abstract

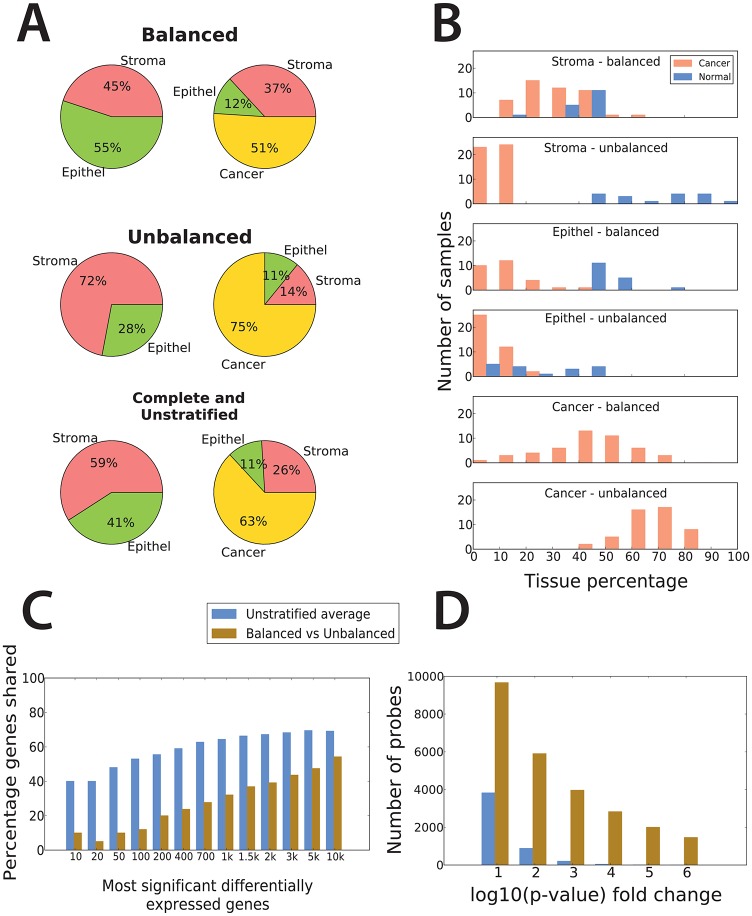
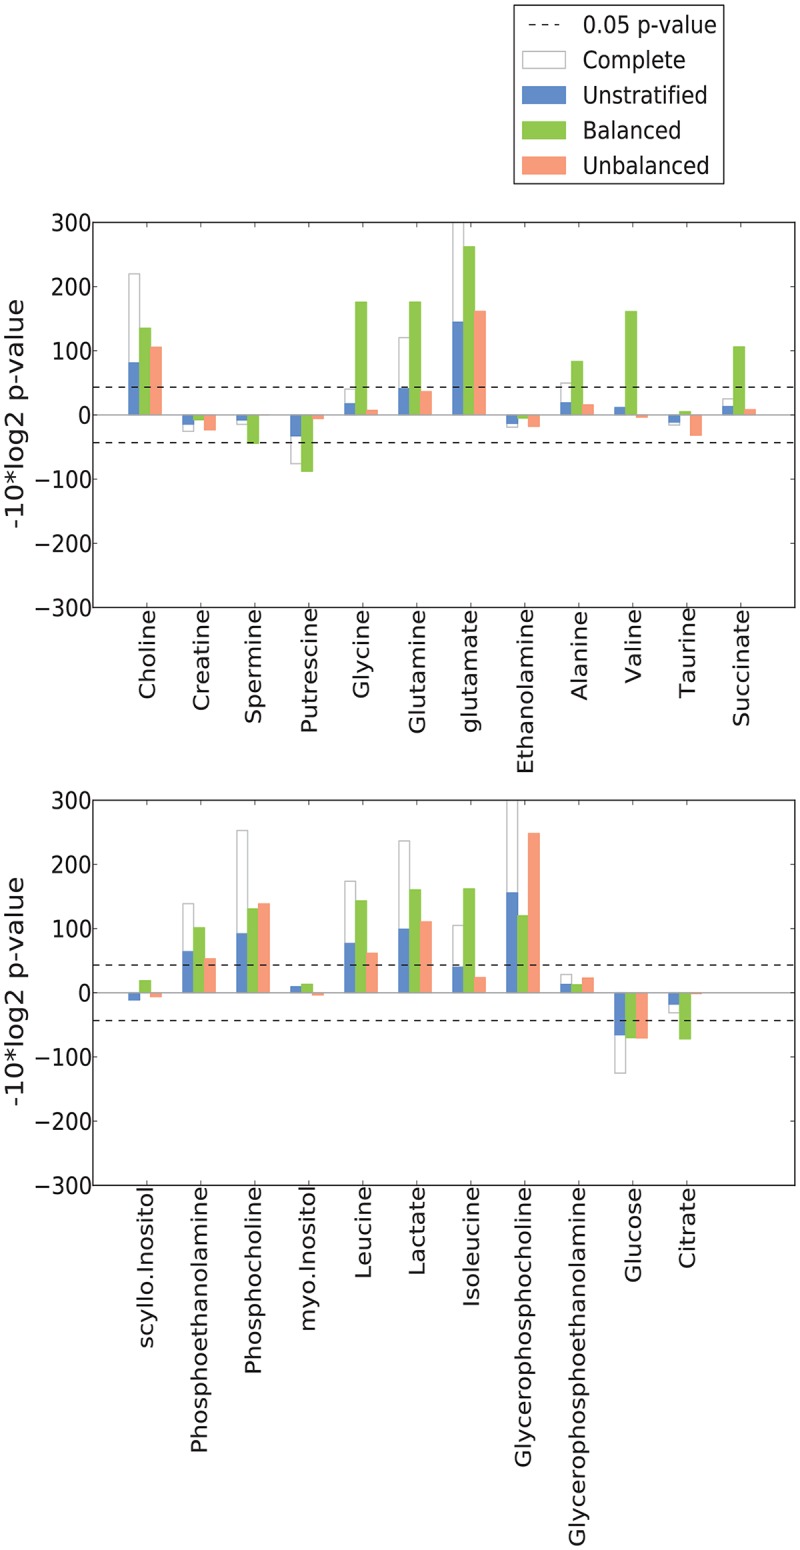
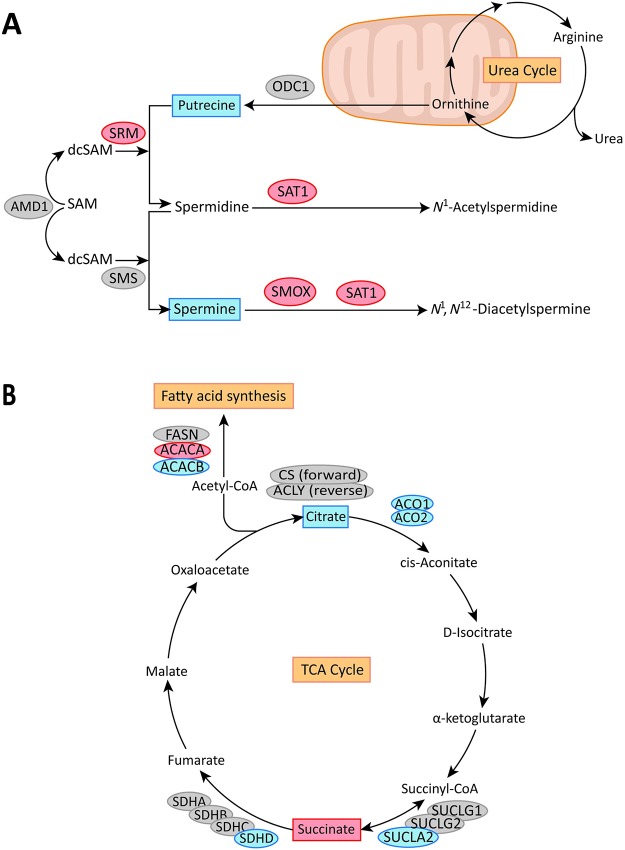
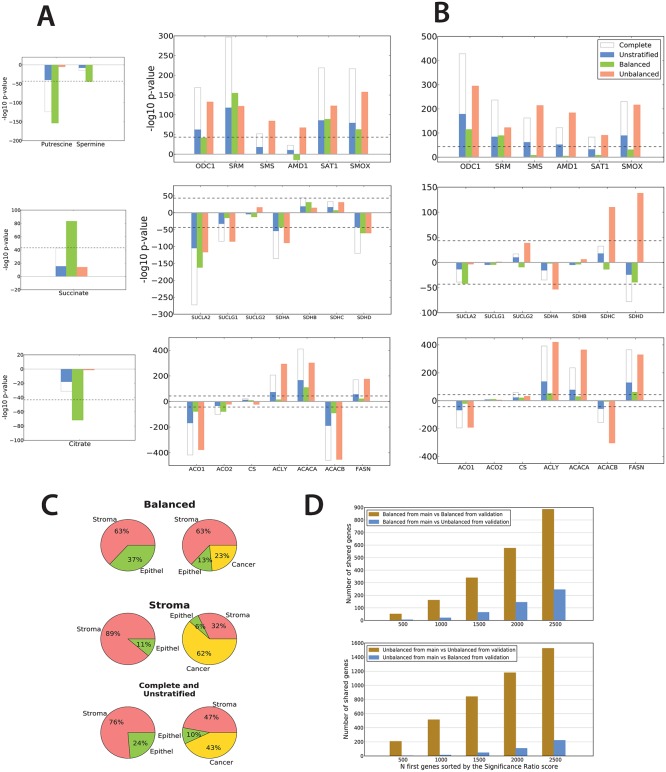
Molecular analysis of patient tissue samples is essential to characterize the in vivo variability in human cancers which are not accessible in cell-lines or animal models. This applies particularly to studies of tumor metabolism. The challenge is, however, the complex mixture of various tissue types within each sample, such as benign epithelium, stroma and cancer tissue, which can introduce systematic biases when cancers are compared to normal samples. In this study we apply a simple strategy to remove such biases using sample selections where the average content of stroma tissue is balanced between the sample groups. The strategy is applied to a prostate cancer patient cohort where data from MR spectroscopy and gene expression have been collected from and integrated on the exact same tissue samples. We reveal in vivo changes in cancer-relevant metabolic pathways which are otherwise hidden in the data due to tissue confounding. In particular, lowered levels of putrescine are connected to increased expression of SRM, reduced levels of citrate are attributed to upregulation of genes promoting fatty acid synthesis, and increased succinate levels coincide with reduced expression of SUCLA2 and SDHD. In addition, the strategy also highlights important metabolic differences between the stroma, epithelium and prostate cancer. These results show that important in vivo metabolic features of cancer can be revealed from patient data only if the heterogeneous tissue composition is properly accounted for in the analysis.


Conflict of interest statement

Competing Interests: The authors of this manuscript have the following competing interests: Tone Bathen is an Academic Editor for PLOS ONE. This does not alter the authors' adherence to all the PLOS ONE policies on sharing data and materials.

Figures

Fig 1
Fig 1. Average tissue composition in balanced and unbalanced datasets produce different sets of differentially expressed genes.
(A) By canceling out the same types of tissues in PCa and normal samples, the balanced dataset compares in average 51% cancer to 43% benign epithelium and 8% stroma. Likewise, the unbalanced dataset compares 75% cancer to 58% stroma and 17% benign epithelium, while the complete and unstratified datasets compares 63% cancer to 33% stroma and 30% benign epithelium. The balanced, unbalanced and unstratified dataset have the same statistical power. Our strategy predicts that differentially expressed genes identified in the balanced dataset set should reflect changes in PCa rather than differences in tissue composition. (B) Histogram of tissue percentage distributions for cancer, stroma and benign epithelium in the balanced and unbalanced datasets. (C) Percentage of DEGs shared between the balanced and unbalanced datasets compared to the average percentage of DEGs shared between the 50 random subsets in the unstratified dataset. Percentages of shared genes are calculated using increasing numbers of the most significant DEGs in each dataset. The random numbers were calculated as the average number of genes shared over all 1225 possible comparisons between the 50 random subsets. For the 200 most significant DEGs, 20% were shared between the balanced and unbalanced datasets, and 39% were shared for the 2000 most significant DEGs. The corresponding percentages for the confounded dataset were 65% and 73% respectively. (D) Microarray probes with a p-value changing in various orders of magnitude between the balanced and unbalanced datasets greatly exceeds p-value changes expected by chance in the unstratified dataset. Of all probes, 2830 showed a p-value fold change of more than four orders of magnitude, and 1460 changed their p-values by more than six orders of magnitude between the balanced and unbalanced datasets compared to 42 and 1 probes for the unstratified dataset respectively.
Fig 2
Fig 2. The balanced dataset improve the identification of significant metabolites altered in prostate cancer (PCa).
Positive -log10(p-value) indicate increased concentration and negative -log10(p-value) indicate reduced concentration in PCa. The unstratified, balanced and unbalanced datasets all have the same statistical power.
Fig 3
Fig 3. Schematic representation of pathways affected by genes and metabolites.
(A) Polyamine pathway. (B) TCA cycle, fatty acid synthesis and glutamine consumption. The genes up- and downregulated in the balanced dataset are highlighted in red and blue respectively. Gene names: ODC1: ornithine decarboxylase 1, SRM: spermidine synthase, SMS: spermine synthase, AMD1: adenosylmethionine decarboxylase 1, SAT1: spermidine/spermine N1-acetyltransferase 1, SMOX: spermine oxidase, ACO1/2: aconitase 1/2, CS: citrate synthase, ACLY: ATP citrate lyase, ACACA/B: acetyl-CoA carboxylase alpha/beta, FASN: fatty acid synthase, SUCLA2: succinate-CoA ligase ADP-forming beta subunit, SUCLG1/2: succinate-CoA ligase beta subunit, SDHA/B/C/D: succinate dehydrogenase complex subunit A/B/C/D.
Fig 4
Fig 4. Integrated analysis of gene expression and metabolite concentrations highlights and validates genes corresponding to metabolic changes in key pathways important for prostate cancer (PCa).
(A) Top: SRM and putrescine in the polyamine pathway. Middle: SUCLA2 and SDHD and succinate in the TCA cycle. Bottom: Citrate in fatty acid synthesis. Positive -log10(p-value) indicate upregulation and negative -log10(p-value) indicate downregulation. The metabolites displayed on the left side are a subset of the metabolites shown in Fig 2. (B) Validation of significant genes in PCa compared to normal samples with respect to the polyamine pathway, succinate in the TCA cycle and fatty acid synthesis in an independent dataset. (C) Average tissue compositions in the balanced, unbalanced and complete/unstratified datasets from the validation study. Histogram of tissue distributions are shown in Figure D in S3 File. (D) Number of shared genes among the N first genes sorted by the significance ratio score when various datasets are compared. Genes with opposite changes (3 in the balanced and 116 in the unbalanced datasets) were removed from analysis. The number shared genes are much higher when balanced and unbalanced datasets are compared between themselves, than when balanced are compared with unbalanced datasets. This indicates that the validation and control studies display a highly concordant ranking of genes for both the balanced and unbalanced datasets.

References

    1. Valkenburg KC, Williams BO (2011) Mouse models of prostate cancer. Prostate Cancer 2011: 895238 10.1155/2011/895238 - DOI - PMC - PubMed
    1. Keshari KR, Sriram R, Van Criekinge M, Wilson DM, Wang ZJ, et al. (2013) Metabolic reprogramming and validation of hyperpolarized 13C lactate as a prostate cancer biomarker using a human prostate tissue slice culture bioreactor. Prostate 73: 1171–1181. 10.1002/pros.22665 - DOI - PMC - PubMed
    1. Liotta L, Petricoin E (2000) Molecular profiling of human cancer. Nat Rev Genet 1: 48–56. - PubMed
    1. Tomlins SA, Mehra R, Rhodes DR, Cao XH, Wang L, et al. (2007) Integrative molecular concept modeling of prostate cancer progression. Nature Genetics 39: 41–51. - PubMed
    1. Barron DA, Rowley DR (2012) The reactive stroma microenvironment and prostate cancer progression. Endocr Relat Cancer 19: R187–204. 10.1530/ERC-12-0085 - DOI - PMC - PubMed

Publication types

MeSH terms