. 2016 Apr 21;11(4):e0153795.
doi: 10.1371/journal.pone.0153795. eCollection 2016.

In Vitro Polarization of Colonoids to Create an Intestinal Stem Cell Compartment

Affiliations

In Vitro Polarization of Colonoids to Create an Intestinal Stem Cell Compartment

Peter J Attayek et al. PLoS One. .

Abstract

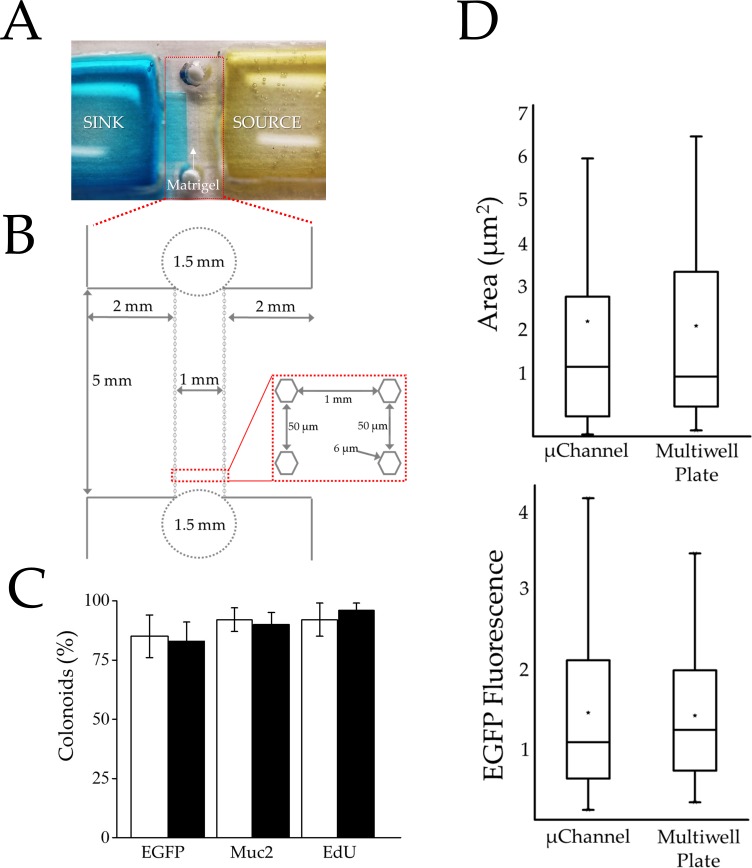
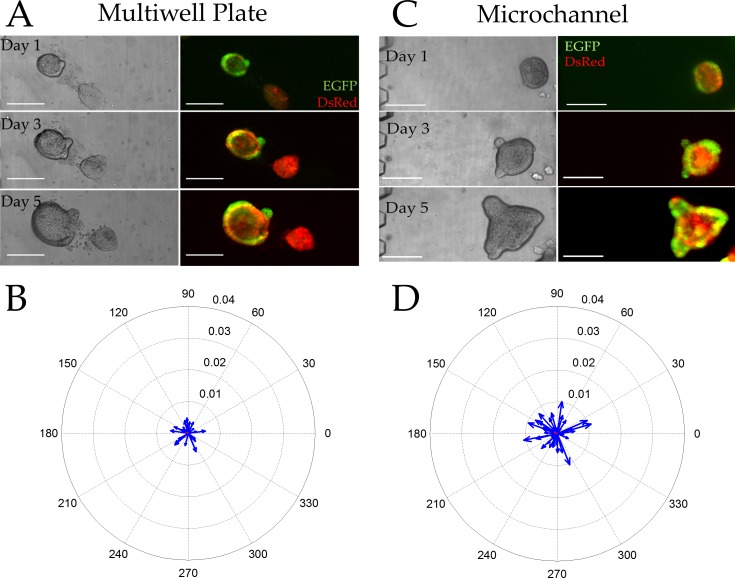
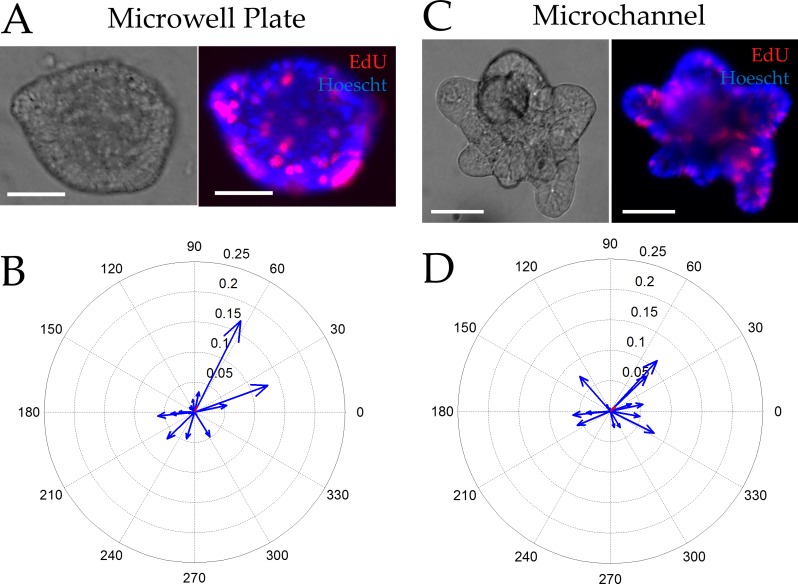
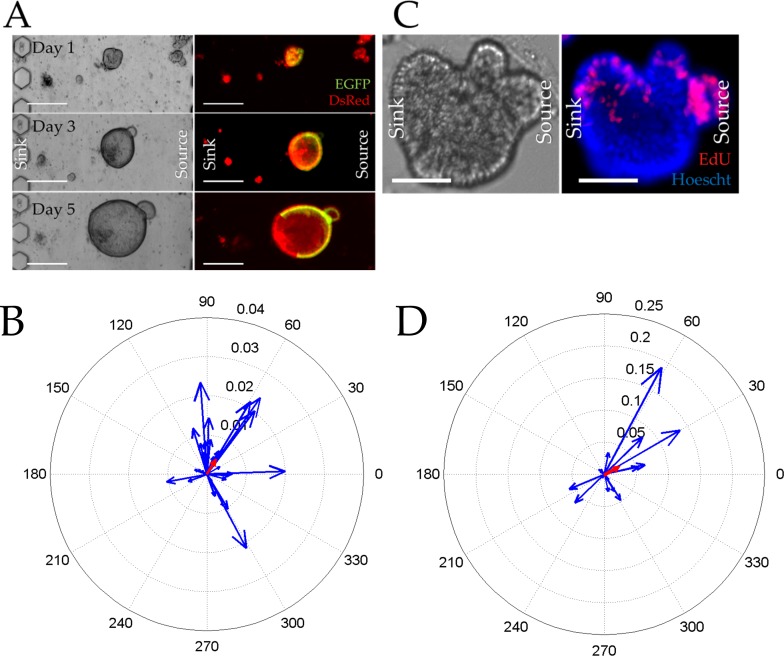
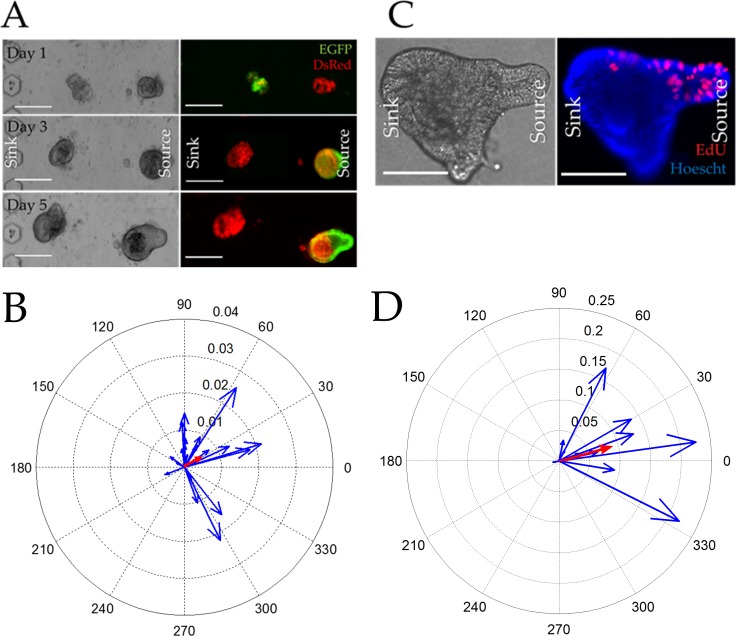
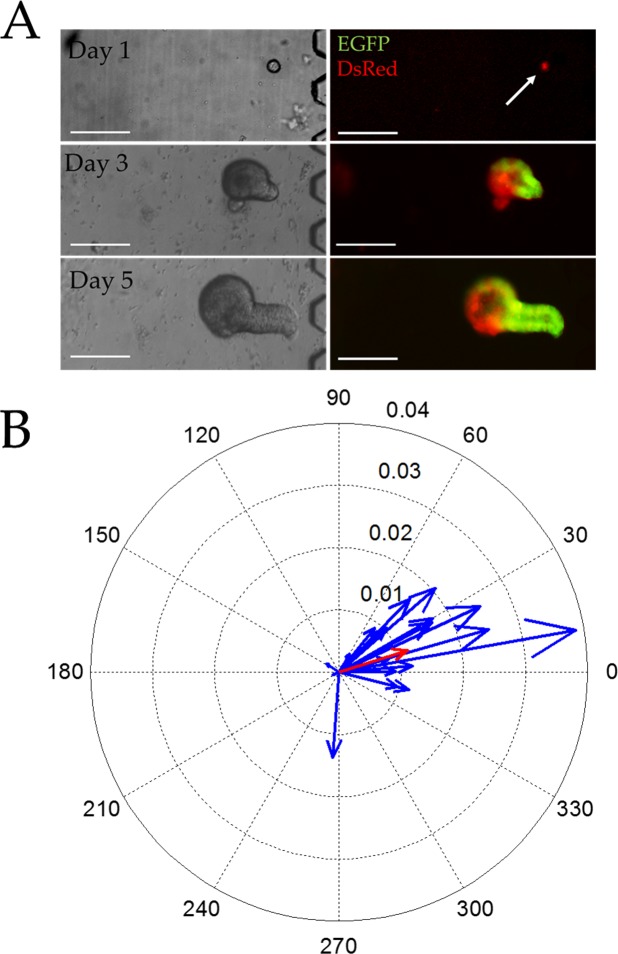
The polarity of proliferative and differentiated cellular compartments of colonic crypts is believed to be specified by gradients of key mitogens and morphogens. Indirect evidence demonstrates a tight correlation between Wnt- pathway activity and the basal-luminal patterning; however, to date there has been no direct experimental manipulation demonstrating that a chemical gradient of signaling factors can produce similar patterning under controlled conditions. In the current work, colonic organoids (colonoids) derived from cultured, multicellular organoid fragments or single stem cells were exposed in culture to steep linear gradients of two Wnt-signaling ligands, Wnt-3a and R-spondin1. The use of a genetically engineered Sox9-Sox9EGFP:CAGDsRED reporter gene mouse model and EdU-based labeling enabled crypt patterning to be quantified in the developing colonoids. Colonoids derived from multicellular fragments cultured for 5 days under a Wnt-3a or a combined Wnt-3a and R-spondin1 gradient were highly polarized with proliferative cells localizing to the region of the higher morphogen concentration. In a Wnt-3a gradient, Sox9EGFP polarization was 7.3 times greater than that of colonoids cultured in the absence of a gradient; and the extent of EdU polarization was 2.2 times greater than that in the absence of a gradient. Under a Wnt-3a/R-spondin1 gradient, Sox9EGFP polarization was 8.2 times greater than that of colonoids cultured in the absence of a gradient while the extent of EdU polarization was 10 times greater than that in the absence of a gradient. Colonoids derived from single stem cells cultured in Wnt-3a/R-spondin1 gradients were most highly polarized demonstrated by a Sox9EGFP polarization 20 times that of colonoids grown in the absence of a gradient. This data provides direct evidence that a linear gradient of Wnt signaling factors applied to colonic stem cells is sufficient to direct patterning of the colonoid unit in culture.


Conflict of interest statement

Competing Interests: The authors declare the following competing financial interest(s): N.L.A., C.E.S., S.T.M. and Y.W. have financial interest in Altis Biosystems, Inc. This does not alter the authors' adherence to PLOS ONE policies on sharing data and materials. There are no restrictions on sharing of data or materials.

Figures

Fig 1
Fig 1. Characterization of the gradient-generating microdevice.
(A) Photograph of the device. The Matrigel-filled gradient region resides between the sink (left with blue dye) and source (right with yellow dye) reservoirs. (B) Schematic of the gradient generating microchannel of the device. The 1.5-mm diameter circles mark the ports for loading Matrigel into the central microchannel. (C) Histogram showing percentages of colonoids possessing Sox9EGFP expression (stem/TA cell), exhibiting Muc2 staining (goblet cells) and labeling with EdU (actively proliferating cells) when cultured in the microchannel (black) or conventional multiwell plate (white). (D) Colonoid area (top) and Sox9EGFP fluorescence (bottom) per colonoid are shown after 5 days in culture in either the microchannel or microwell. Boxplots were used to represent the non-normal data distribution. Colonoid area is represented as μm2 (× 104) and Sox9EGFP fluorescence intensity is represented as RFUs (× 105). For the boxplots, the black star indicates the mean of the data, the bar shows the median, and the upper and lower boxes represent the 75% and 25% of the data, respectively. The whiskers extend to the 5% and 95% of the data.
Fig 2
Fig 2. Colonoid properties in the absence of a gradient.
(A, C) Brightfield (left) and overlaid red/green fluorescence (right) images of colonoids cultured within a standard multiwell plate (A) or microchannel (C) for 1, 3, and 5 days Scale bars represent 250 μm. (B, D) Compass plots displaying the Sox9EGFP polarization magnitude and angle for individual colonoids cultured in the multiwell plate (B) or microchannel (C) for 5 days (n = 49 colonoids in 10 microchannels and n = 30 colonoids in 5 wells). The blue vectors represent individual colonoids while the average magnitude and angle of the vector is marked in red (poorly visualized due to the near-zero magnitude).
Fig 3
Fig 3. Incorporation of EdU into colonoids after a 2 h pulse in the absence of a gradient.
(A,C) Brightfield (left) and overlaid red/blue fluorescence (right) images of colonoids cultured within a multiwell plate (A) or microchannel (C) for 5 days then labeled with EdU (red) and the Hoechst 33342 (blue) (n = 18 colonoids in 5 microchannels and n = 16 colonoids in 3 multiwells). Scale bars represent 50 μm. (B, D) Compass plots displaying the EDU polarization magnitude and angle for individual colonoids (blue) cultured in the multiwell plate (B) or microchannel (C) for 5 days and pulsed with EdU. The average magnitude and angle of the vector can be seen in red (poorly visualized due to the near-zero magnitude).
Fig 4
Fig 4. Colonoid growth in the presence of a Wnt-3a gradient across the microchannel.
(A) Brightfield (left) and overlaid red/green fluorescence (right) images of colonoids cultured under a Wnt-3a gradient for 1, 3, and 5 d. The scale bar is 250 μm. (B) Compass plot displaying the Sox9EGFP polarization magnitude and angle for individual colonoids cultured under the Wnt-3a gradient for 5 days (n = 28 colonoids on 5 devices). The average magnitude and angle of the vector can be seen in red. (C) Brightfield (left) and overlaid red/blue fluorescence (right) images of colonoids cultured under a Wnt-3a gradient for 5 days then pulse-labeled with EdU (red) for 2 h. Hoechst 33342 fluorescence is shown in blue. The scale bar represents 50 μm. (D) Compass plot displaying the EDU polarization magnitude and angle for individual colonoids (blue) cultured as described in (C) (15 colonoids in 5 microchannels). The average magnitude and angle of the vector can be seen in red.
Fig 5
Fig 5. Colonoid growth in the presence of a dual Wnt-3a/R-spondin1 gradient.
(A) Brightfield (left) and overlaid red/green fluorescence (right) images of colonoids cultured under a Wnt-3a/R-spondin1 gradient for 1, 3, and 5 days in the microchannel. The scale bar is 250 μm. (B) Compass plot displaying the Sox9EGFP polarization magnitude and angle for individual colonoids (blue) cultured under the Wnt-3a/R-spondin1 gradient for 5 days (n = 33 colonoids from 6 microchannels). The average magnitude and angle of the vector can be seen in red. (C) Brightfield (left) and overlaid red/blue fluorescence (right) images of colonoids cultured the gradient for 5 days then pulse-labeled with EdU (red) for 2 h. Hoechst 33342 fluorescence is shown in blue. The scale bar represents 50 μm. (D) Compass plot displaying the EDU polarization magnitude and angle for individual colonoids (blue) cultured as described in (C) (n = 11 colonoids in 4 microchannels). The average magnitude and angle of the vector can be seen in red.
Fig 6
Fig 6. Growth of single stem cells in the presence of a Wnt-3a/R-spondin1 gradient.
(A) Brightfield (left) and overlaid red/green fluorescence (right) images of single stem cells cultured under a Wnt-3a/R-spondin1 gradient for 1, 3, and 5 days in the microchannel. The scale bar is 250 μm. (B) Compass plot displaying the Sox9EGFP polarization magnitude and angle for the single colonoids (blue) under the Wnt-3a/R-spondin1 gradient for 5 days (n = 23 colonoids in 5 microchannels). The average magnitude and angle of the vector can be seen in red.

References

    1. Krausova M, Korinek V. Wnt signaling in adult intestinal stem cells and cancer. Cellular Signalling. 2014;26:570–9. 10.1016/j.cellsig.2013.11.032 - DOI - PubMed
    1. Schepers A, Clevers H. Wnt signaling, stem cells, and cancer of the gastrointestinal Ttract. Cold Spring Harbor Perspectives in Biology. 2012;4:a007989 10.1101/cshperspect.a007989 - DOI - PMC - PubMed
    1. Scoville DH, Sato T, He XC, Li LH. Current view: Intestinal stem cells and signaling. Gastroenterology. 2008;134:849–64. 10.1053/j.gastro.2008.01.079 - DOI - PubMed
    1. Clevers H. The intestinal crypt, a prototype stem cell compartment. Cell. 2013;154:274–84. 10.1016/j.cell.2013.07.004 - DOI - PubMed
    1. Clevers H. Stem Cells: A unifying theory for the crypt. Nature. 2013;495:53–4. 10.1038/nature11958 - DOI - PubMed

Publication types