. 2016 Sep;26(9):1213-30.
doi: 10.1002/hipo.22600. Epub 2016 May 24.

Subcortical connections of the perirhinal, postrhinal, and entorhinal cortices of the rat. II. efferents

Affiliations

Subcortical connections of the perirhinal, postrhinal, and entorhinal cortices of the rat. II. efferents

Kara L Agster et al. Hippocampus. 2016 Sep.

Abstract

This is the second of two studies detailing the subcortical connections of the perirhinal (PER), the postrhinal (POR) and entorhinal (EC) cortices of the rat. In the present study, we analyzed the subcortical efferents of the rat PER areas 35 and 36, POR, and the lateral and medial entorhinal areas (LEA and MEA). Anterograde tracers were injected into these five regions, and the resulting density of fiber labeling was quantified in an extensive set of subcortical structures. Density and topography of fiber labeling were quantitatively assessed in 36 subcortical areas, including olfactory structures, claustrum, amygdala nuclei, septal nuclei, basal ganglia, thalamic nuclei, and hypothalamic structures. In addition to reporting the density of labeled fibers, we incorporated a new method for quantifying the size of anterograde projections that takes into account the volume of the target subcortical structure as well as the density of fiber labeling. The PER, POR, and EC displayed unique patterns of projections to subcortical areas. Interestingly, all regions examined provided strong input to the basal ganglia, although the projections arising in the PER and LEA were stronger and more widespread. PER areas 35 and 36 exhibited similar pattern of projections with some differences. PER area 36 projects more heavily to the lateral amygdala and much more heavily to thalamic nuclei including the lateral posterior nucleus, the posterior complex, and the nucleus reuniens. Area 35 projects more heavily to olfactory structures. The LEA provides the strongest and most widespread projections to subcortical structures including all those targeted by the PER as well as the medial and posterior septal nuclei. POR shows fewer subcortical projections overall, but contributes substantial input to the lateral posterior nucleus of the thalamus. The MEA projections are even weaker. Our results suggest that the PER and LEA have greater influence over olfactory, amygdala, and septal nuclei, whereas PER area 36 and the POR have greater influence over thalamic nuclei. © 2016 Wiley Periodicals, Inc.

Keywords: anatomy; anterograde; connectivity; memory; parahippocampal.


Figures

Figure 1
Figure 1
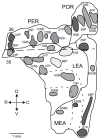
Location of injection sites within the parahippocampal regions. Injection sites are represented on an unfolded map of the parahippocampal region. Dark grey shading represents injection sites to deep layers of cortex, medium grey represents tracer injections to deep and superficial layers of cortex, and light grey shading represent tracer injections to superficial layers of cortex. Solid lines separate the parahippocampal regions (PER area 35, PER area 36, POR, LEA and MEA), the wide-dash line represents the rhinal sulcus, and the small dashed lines separate projecting bands from the EC to the HPC into lateral, intermediate and medial.
Figure 2
Figure 2
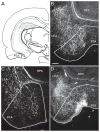
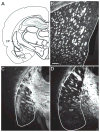
Darkfield photomicrographs showing the distribution of fiber labeling in the PTA (one of the olfactory subcortical nuclei) following anterograde tracer injections in parahippocampal regions. A. Schematic showing the approximate level of the photomicrographs. B. Fiber labeling following anterograde tracer injection to PER area 35 (Case 24P). Very dense fiber labeling was observed. C. Fiber labeling as a result of tracer injection to PER area 36 (Case 62B). Dense fibers were observed but less than in area 35 or LEA. D. Fiber labeling as a result of tracer injection to LEA (Case 57P). Very dense fibers were observed in PTA. Other dense labeling is observed at the injection site in LEA. For abbreviations, see Table 1. Scale bar: 250μm.
Figure 3
Figure 3
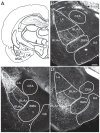
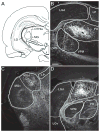
Darkfield photomicrographs showing the distribution of fiber labeling in the amygdala nuclei. A. Schematic illustrating the approximate level of the photomicrographs. B. Fiber labeling following anterograde tracer injection to PER area 35 (Case 24P). Moderate fiber labeling is observed in the LA, BLA, and BMA. Within BLA, the posterior region shows stronger labeling than the anterior region. C. Fiber labeling as a result of anterograde tracer injection to PER area 36 (Case 128B). Very dense fiber labeling is observed in the LA. Moderate fiber labeling is observed in the BLA. D. Fiber labeling as a result of anterograde tracer injection to the LEA (Case 57P). Strong fiber labeling is observed in the BLA, particularly the posterior region. LA and BMA shown moderate fiber labeling. For abbreviations, see Table 1. Other abbreviations: BLAa – basolateral nucleus of the amygdala (anterior region); BLAp – basolateral nucleus of the amygdala (posterior region). Scale bar: 250 μm.
Figure 4
Figure 4
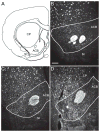
Darkfield photomicrograph showing the distribution of fiber labeling in a selection of basal ganglia structures following anterograde trace injections into PER and LEA. A. Schematic showing the approximate level of the photomicrographs. B. Fiber labeling as a result of anterograde tracer injection to PER area 35 (Case 24P). Dense fibers are observed in ACB with moderate density in CP. C. Fiber labeling following anterograde tracer injection to PER area 36 (Case 54P). Dense fiber labeling is observed in both CP and ACB. D. Fiber labeling as a result of anterograde tracer injection to the LEA (Case 127B). Dense fibers observed in ACB, CP and moderate fiber density in SI. For abbreviations, see Table 1. Scale bar: 250μm.
Figure 5
Figure 5
Darkfield photomicrograph showing the distribution of fiber labeling in the CP following tracer injections to the POR and MEA. A. Schematic showing the approximate level of the photomicrographs in C and D. B. Fiber labeling in CP at the anterior level as a result of anterograde tracer injection the POR (Case 39P). Weak fiber labeling is observed clustered particularly in the medial region. C. Fiber labeling in posterior CP in the same case as B (Case 39P). Very dense labeling is observed in clusters along the lateral wall of the nucleus. D. Fiber labeling observed in the CP following anterograde tracer injection to the MEA (Case 28P). Few fibers are observed. For abbreviations, see Table 1. Scale bar: 250μm.
Figure 6
Figure 6
Darkfield photomicrographs showing examples of fiber labeling in some nuclei of the dorsal and ventrolateral thalamus. A. Schematic showing the approximate level of the photomicrographs in B and D. B. Fiber labeling as a result of anterograde tracer injection to PER area 36 (Case 54B). Very dense labeling is observed in the posterior complex of the DTHla, but not in the lateral posterior nucleus of DTHla. C. Fiber labeling as a result of anterograde tracer injection to PER area 36 (Case 45P). Labeling is moderate considering the MG as a whole, but dense fibers are present in the dorsal region. D. Fiber labeling as a result of anterograde tracer injection to the POR (Case 83B). Fibers terminate strongly in the lateral posterior nucleus of the DTHla, but weakly in the posterior complex. Some fiber labeling is also observed in the lateral geniculate (dorsal region). For abbreviations, see Table 1. Other abbreviations: LGd – lateral geniculate (dorsal region); LGv – lateral geniculate (ventral region); LP – lateral posterior nucleus of the thalamus (part of DTHla); MGd – medial geniculate (dorsal region); MGv – medial geniculate (ventral region); PO – posterior complex of the thalamus (part of DTHla); VPL – ventral posterior complex of the dorsal thalamus (lateral region; part of DTHve); VPM – ventral posterior complex of the dorsal thalamus (medial region; part of DTHve). Scale bar: 250μm.
Figure 7
Figure 7
Wiring diagram representing subcortical output of the parahippocampal regions based on the densities of labeled cells in each subcortical structure (Table 3). The density measure allows for comparisons of the strength of the parahippocampal input to a specific subcortical nucleus. Accordingly, the projections are color coded according to their region of origin. The thickness of the lines indicates the relative strength of the projection. Information for connections shown in black are from prior studies (Agster and Burwell, 2013; Burwell and Amaral, 1998b). For simplicity, the weakest connections (<1.5) are not shown. See Table 1 for a list of abbreviations.
Figure 8
Figure 8
Wiring diagram representing the volume normalized density of efferent projections from the parahippocampal regions to the subcortical nuclei (Table 4). This normalization allows for comparison of overall size and target of the complement of subcortical projections originating in a particular parahippocampal region. The projections are color coded according to their target region. The thickness of the lines indicates the relative strength of the projection. Information for connections shown in black are from prior studies (Agster and Burwell, 2013; Burwell and Amaral, 1998b). For simplicity, the weakest connections (<1.5) are not shown. See Table 1 for a list of abbreviations.

References

    1. Agster KL, Burwell RD. Cortical efferents of the perirhinal, postrhinal, and entorhinal cortices of the rat. Hippocampus. 2009;19(12):1159–1186. - PMC - PubMed
    1. Agster KL, Burwell RD. Hippocampal and subicular efferents and afferents of the perirhinal, postrhinal, and entorhinal cortices of the rat. Behavioral Brain Research. 2013;254:50–64. - PMC - PubMed
    1. Albasser MM, Amin E, Iordanova MD, Brown MW, Pearce JM, Aggleton JP. Separate but interacting recognition memory systems for different senses: the role of the rat perirhinal cortex. Learn Mem. 2011;18(7):435–43. - PMC - PubMed
    1. Baizer JS, Sherwood CC, Noonan M, Hof PR. Comparative organization of the claustrum: what does structure tell us about function? Front Syst Neurosci. 2014;8:117. - PMC - PubMed
    1. Blackstad TW. Commissural connections of the hippocampal region in the rat, with special reference to their mode of termination. J Comp Neurol. 1956;105:417–537. - PubMed

Publication types

LinkOut - more resources