. 2016 Jul 10;377(1):55-64.
doi: 10.1016/j.canlet.2016.04.020. Epub 2016 Apr 18.

The transcriptional modulator HMGA2 promotes stemness and tumorigenicity in glioblastoma

Affiliations

The transcriptional modulator HMGA2 promotes stemness and tumorigenicity in glioblastoma

Harpreet Kaur et al. Cancer Lett. .

Abstract

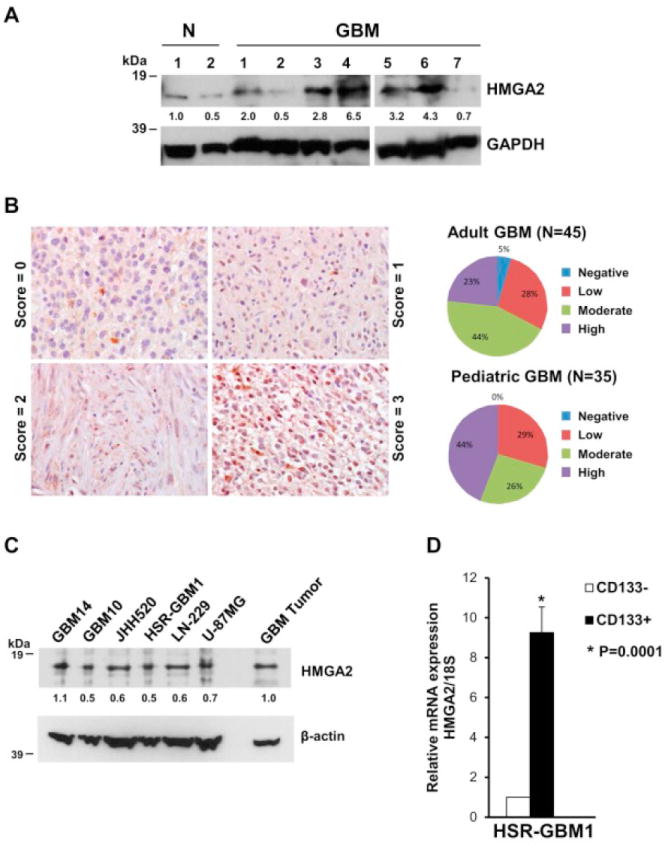
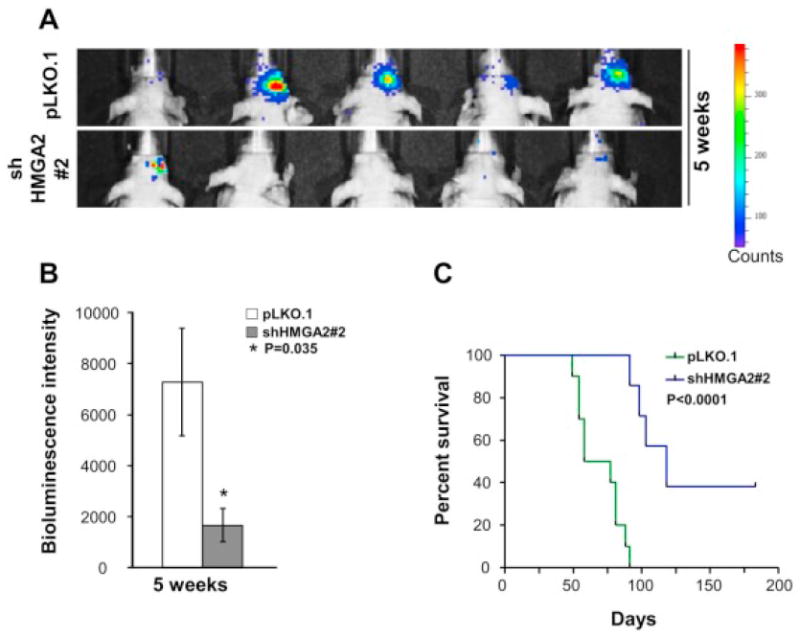
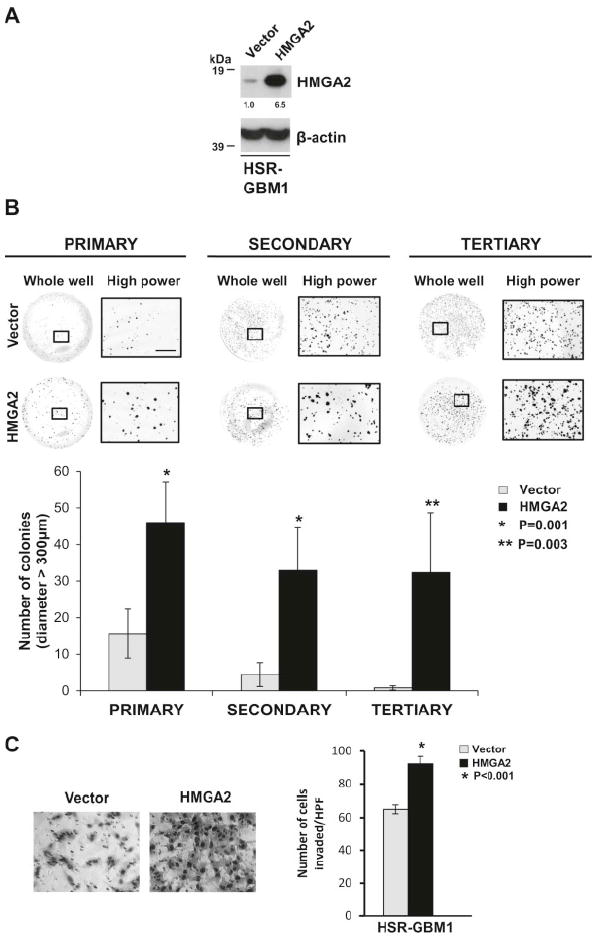
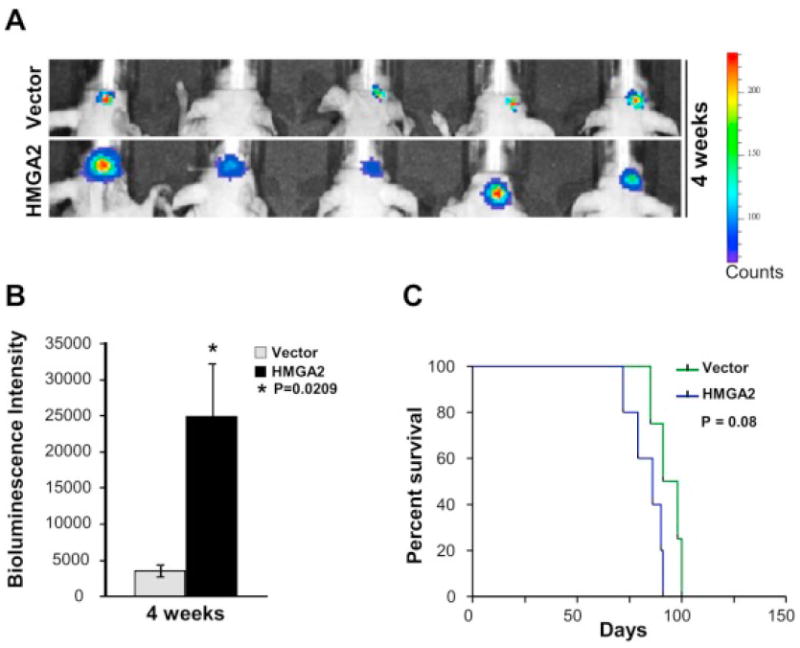
Glioblastoma (GBM) contains a population of stem-like cells that promote tumor invasion and resistance to therapy. Identifying and targeting stem cell factors in GBM may lead to the development of more effective therapies. High Mobility Group AT-hook 2 (HMGA2) is a transcriptional modulator that mediates motility and self-renewal in normal and cancer stem cells. We identified increased expression of HMGA2 in the majority of primary human GBM tumors and cell lines compared to normal brain. Additionally, HMGA2 expression was increased in CD133+ GBM neurosphere cells compared to CD133- cells. Targeting HMGA2 with lentiviral short hairpin RNA (shRNA) led to decreased GBM stemness, invasion, and tumorigenicity. Ectopic expression of HMGA2 in GBM cell lines promoted stemness, invasion, and tumorigenicity. Our data suggests that targeting HMGA2 in GBM may be therapeutically beneficial.

Keywords: Clonogenicity; GSC; Glioma; HMGI-C; Motility.


Conflict of interest statement

None.

Figures

Figure 1
Figure 1
The majority of GBM primary tumors and cell lines show increased expression of HMGA2. (A) Western blot showing increased expression of HMGA2 protein in 71% (5/7) primary tumor samples from GBM patients compared to normal (N) brain tissue (cortex). GAPDH was used as a loading control. HMGA2 and GAPDH protein levels were quantitated using densitometry. Values normalized to sample#1 of normal brain tissue (N) are depicted below the blots. (B) Immunohistochemical analysis showing varying expression of HMGA2 in primary GBM samples on a tissue microarray (Scores: 0 or negative =no staining, 1=low staining, 2=moderate staining, 3=high staining). Quantitation of the percentage of tumor samples showing the staining is depicted at right. (C) Western blot showing HMGA2 expression in GBM cell lines (GBM14, GBM10, JHH520, HSR-GBM1, LN-229 and U-87 MG). A primary tumor sample is also shown for comparison of HMGA2 expression. β-actin was used as a loading control. HMGA2 and β-actin protein levels were quantitated on the western blot using densitometry and values normalized to the primary tumor sample for each cell line are depicted below the blots. (D) Increased expression of HMGA2 mRNA by quantitative PCR in CD133+ HSR-GBM1 neurospheres compared to CD133- cells. Data were normalized to 18S ribosomal RNA and are shown as relative expression (relative to CD133- cells) (*P=0.0001 by Student’s t-test, N=2).
Figure 2
Figure 2
shRNA mediated knockdown of HMGA2 reduces GBM cell invasion and colony formation in vitro. (A) Western blots showing reduction of HMGA2 expression with two different shRNA (shHMGA2#1 and shHMGA2#2) compared to control vector (pLKO.1 and SCRAMBLE) infected cells in HSR-GBM1 and LN-229 cell lines. GAPDH was used as a loading control. HMGA2 and GAPDH protein levels were quantitated on the western blot using densitometry and values normalized to pLKO.1 for each cell line are depicted below the blots. (B) Left, HSR-GBM1 cells showing 79% reduction in colony formation with shHMGA2#2 in soft agar compared to control infected cells (*P<0.0001 by Student’s t-test, N=2). Right, Quantitation of the number of colonies is shown on the right. (C) Left, Photomicrographs (20X) showing reduced invasion of HSR-GBM1 and LN-229 cells infected with shHMGA2 compared to pLKO.1 infected cells in Matrigel transwell assay. Right, Quantitation of photomicrographs shown in (C). For HSR-GBM1: 57% and 50% reduction with shHMGA2#1 and #2, respectively, *P<0.001 for shHMGA2#1 and *P=0.001 for shHMGA2#2 by Student’s t-test, N=2. For LN-229: 73% and 44% reduction with shHMGA2#1 and shHMGA2#2, respectively, compared to pLKO.1 infected cells, *P<0.001 by Student’s t-test, N=2.
Figure 3
Figure 3
shRNA mediated knockdown of HMGA2 in GBM neurosphere cells inhibits intracranial tumor growth in immunocompromised mice. (A) Photographs of xenografted mice showing decreased bioluminescence intensity depicting reduced intracranial tumor growth with knockdown of HMGA2 (shHMGA2#2) in HSR-GBM1 cells at 5 weeks post injection compared to control mice (pLKO.1). (B) Quantitation of the intensity of bioluminescence showing 77% reduction with shHMGA2#2 xenografted mice at 5 weeks, respectively, compared to pLKO.1 mice, *P=0.035 by Student’s t-test, N=5. (C) Kaplan-Meier survival analysis depicting decreased survival of mice injected with HSR-GBM1 neurospheres expressing shHMGA2#2 compared to control infected cells (P<0.0001, N=10 for pLKO.1 and N=7 for shHMGA2#2).
Figure 4
Figure 4
Overexpression of HMGA2 increases GBM cell invasion and clonogenicity in vitro. (A) Western blot showing increased expression of HMGA2 in HSR-GBM1 neurospheres infected with retroviral HMGA2 (HMGA2) compared to control vector (Vector). β-actin was used as a loading control. Densitometry values normalized to control vector are depicted below the blots. (B) Photos and quantification depicting increase in the number of larger colonies (diameter>300μm) formed by HSR-GBM1 neurospheres expressing retroviral HMGA2 compared to control vector cells in methylcellulose assays in vitro (*P=0.001 and 0.003 by Student’s t-test, N=3). Scale bar = 2500 micrometers on high power macrophotographs. (C) Photomicrographs (20X) depicting increased invasion of HSR-GBM1 neurospheres expressing HMGA2 compared to control vector infected cells in Matrigel-transwell invasion assays in vitro. Quantification depicting increase in invasion is shown on the right (*P<0.001 by Student’s t-test, N=3).
Figure 5
Figure 5
Overexpression of HMGA2 increases intracranial tumor growth in vivo (A) Increased bioluminescence intensity depicting increased intracranial tumor growth at 4 weeks post injection with overexpression of HMGA2 compared to control vector mice. (B) Quantitation of the increased bioluminescence intensity observed in (A) depicting 7.0 fold increase in HMGA2 overexpressing xenografted mice compared to controls (*P=0.0209 by Student’s t-test, N=5). (C) Kaplan Meier survival curves show a decrease in median survival with overexpression of HMGA2 in GBM1 neurospheres (P=0.08, N=5).

References

    1. Ostrom QT, Gittleman H, Liao P, Rouse C, Chen Y, Dowling J, Wolinsky Y, Kruchko C, Barnholtz-Sloan J. CBTRUS statistical report: primary brain and central nervous system tumors diagnosed in the United States in 2007-2011. Neuro-oncology. 2014;16(Suppl 4):iv1–63. - PMC - PubMed
    1. Agnihotri S, Burrell KE, Wolf A, Jalali S, Hawkins C, Rutka JT, Zadeh G. Glioblastoma, a brief review of history, molecular genetics, animal models and novel therapeutic strategies. Archivum immunologiae et therapiae experimentalis. 2013;61:25–41. - PubMed
    1. Dunn GP, Rinne ML, Wykosky J, Genovese G, Quayle SN, Dunn IF, Agarwalla PK, Chheda MG, Campos B, Wang A, Brennan C, Ligon KL, Furnari F, Cavenee WK, Depinho RA, Chin L, Hahn WC. Emerging insights into the molecular and cellular basis of glioblastoma. Genes & development. 2012;26:756–784. - PMC - PubMed
    1. Furnari FB, Fenton T, Bachoo RM, Mukasa A, Stommel JM, Stegh A, Hahn WC, Ligon KL, Louis DN, Brennan C, Chin L, DePinho RA, Cavenee WK. Malignant astrocytic glioma: genetics, biology, and paths to treatment. Genes & development. 2007;21:2683–2710. - PubMed
    1. Anton K, Baehring JM, Mayer T. Glioblastoma multiforme: overview of current treatment and future perspectives. Hematology/oncology clinics of North America. 2012;26:825–853. - PubMed

Publication types

MeSH terms

LinkOut - more resources