

Cancer incidence in urban Shanghai, 1973-2010: an updated trend and age-period-cohort effects
- PMID: 27102013
- PMCID: PMC4839149
- DOI: 10.1186/s12885-016-2313-2
Cancer incidence in urban Shanghai, 1973-2010: an updated trend and age-period-cohort effects
Abstract
Background: To provide a comprehensive overview of temporal trends in cancer incidence during 1973-2010 in urban Shanghai.
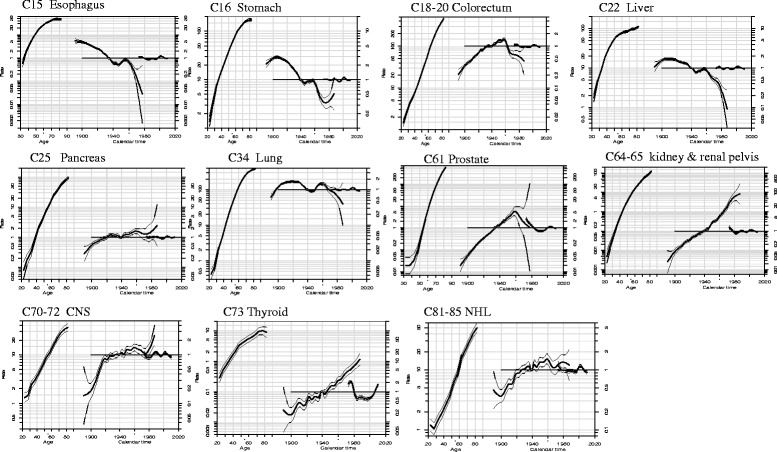
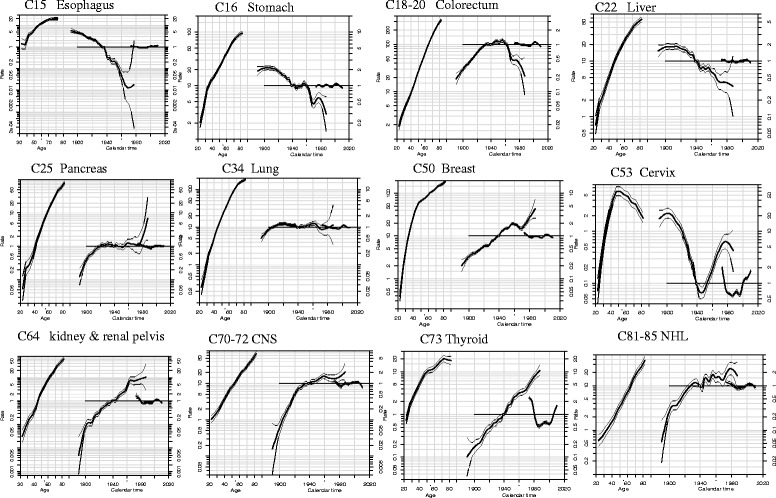
Methods: The estimated annual percent changes (EAPCs) for the whole period and for the time segments in age-standardized incidence rates (ASR) were evaluated with Joinpoint analysis. Age-period-cohort (APC) models were modeled to examine the effects of age, period and birth cohort on cancer incidence.
Results: The overall ASR decreased slightly and significantly in males (EAPC of -0.41) but increased significantly in females (EAPC of 0.57) during 1973-2010 in urban Shanghai. The incidence trend was not linear and varied by time segments. During the most recent 10 years (2001-2010), the ASR in males decreased by 1.65% per year and stabilized in females. Incidence rates continued to decline during 1973-2010 for esophagus, stomach, and liver cancer in both sexes, as well as male lung cancer and cervix cancer. It should be noted that it was the first time to document a significant decline in lung cancer incidence among males during 1973-2010 with EAPC of -0.58%, and a notable upward for cervix cancer since 1996 with EAPC of 8.94%. Unfavorable trends in incidence were observed for the most common cancer sites in the 38 years period: colorectum, gallbladder & biliary tract, pancreas, kidney, bladder, brain & central nervous system (CNS), thyroid, non-Hodgkin's lymphoma (NHL), prostate, female breast, corpus uteri, and ovary. APC analysis showed age, period and birth cohort yielded different effects by cancer sites.
Conclusions: The observed trends primarily reflect dramatic changes in socioeconomic development and lifestyles in urban Shanghai over the past four decades.
Keywords: Age-period-cohort analysis; Cancer incidence; Shanghai; Time trend.
Figures
Similar articles
-
[Recent incidences and trends of childhood malignant solid tumors in Shanghai, 2002-2010].Zhonghua Er Ke Za Zhi. 2013 Apr;51(4):288-94. Zhonghua Er Ke Za Zhi. 2013. PMID: 23927803 Chinese.
-
Trends in childhood cancer incidence and mortality in urban Shanghai, 1973-2005.Pediatr Blood Cancer. 2010 Jul 1;54(7):1009-13. doi: 10.1002/pbc.22383. Pediatr Blood Cancer. 2010. PMID: 20052777
-
Time trends of major cancers incidence and mortality in Guangzhou, China 2004-2015: A Joinpoint and Age-Period-Cohort Analysis.Cancer Med. 2021 Apr;10(8):2865-2876. doi: 10.1002/cam4.3744. Epub 2021 Mar 16. Cancer Med. 2021. PMID: 33724715 Free PMC article.
-
[Time trends and characteristics of gastric cancer incidence in urban Shanghai].Zhonghua Liu Xing Bing Xue Za Zhi. 2007 Sep;28(9):875-80. Zhonghua Liu Xing Bing Xue Za Zhi. 2007. PMID: 18251271 Chinese.
-
Cancer incidence trends in urban Shanghai, 1972-1989.Int J Cancer. 1993 Mar 12;53(5):764-70. doi: 10.1002/ijc.2910530510. Int J Cancer. 1993. PMID: 8449600
Cited by
-
Cohort profile: protocol and baseline survey for the Shanghai Suburban Adult Cohort and Biobank (SSACB) study.BMJ Open. 2020 Jul 8;10(7):e035430. doi: 10.1136/bmjopen-2019-035430. BMJ Open. 2020. PMID: 32641326 Free PMC article.
-
Optimising colorectal cancer screening in Shanghai, China: a modelling study.BMJ Open. 2022 May 16;12(5):e048156. doi: 10.1136/bmjopen-2020-048156. BMJ Open. 2022. PMID: 35577474 Free PMC article.
-
Diet and biliary tract cancer risk in Shanghai, China.PLoS One. 2017 Mar 13;12(3):e0173935. doi: 10.1371/journal.pone.0173935. eCollection 2017. PLoS One. 2017. PMID: 28288186 Free PMC article.
-
Long-term trends and survival analysis of esophageal and gastric cancer in Yangzhong, 1991-2013.PLoS One. 2017 Mar 13;12(3):e0173896. doi: 10.1371/journal.pone.0173896. eCollection 2017. PLoS One. 2017. PMID: 28288195 Free PMC article.
-
Distinctive lung cancer incidence trends among men and women attributable to the period effect in Shanghai: An analysis spanning 42 years.Cancer Med. 2020 Apr;9(8):2930-2939. doi: 10.1002/cam4.2917. Epub 2020 Feb 19. Cancer Med. 2020. PMID: 32073760 Free PMC article.
References
-
- Waterhouse J, Muir C, Shanmugaratnam K, Powell J. Cancer incidence in five continents. Volume IV, 1982/01/01 edn. Lyon: IARC; 1982.
-
- Curado MP, Edwards B, Shin HR, Storm H, Ferlay J, Heanue M, Boyle P. Cancer incidence in five continents. Volume IX, 2008/01/01 edn. Lyon: IARC; 2008.
Publication types
MeSH terms
LinkOut - more resources
Full Text Sources
Other Literature Sources
Miscellaneous
