Obesity and its Relation With Diabetes and Hypertension: A Cross-Sectional Study Across 4 Geographical Regions
- PMID: 27102024
- PMCID: PMC4843822
- DOI: 10.1016/j.gheart.2016.01.003
Obesity and its Relation With Diabetes and Hypertension: A Cross-Sectional Study Across 4 Geographical Regions
Abstract
Background: The implications of rising obesity for cardiovascular health in middle-income countries has generated interest, in part because associations between obesity and cardiovascular health seem to vary across ethnic groups.
Objective: We assessed general and central obesity in Africa, East Asia, South America, and South Asia. We further investigated whether body mass index (BMI) and waist circumference differentially relate to cardiovascular health; and associations between obesity metrics and adverse cardiovascular health vary by region.
Methods: Using baseline anthropometric data collected between 2008 and 2012 from 7 cohorts in 9 countries, we estimated the proportion of participants with general and central obesity using BMI and waist circumference classifications, respectively, by study site. We used Poisson regression to examine the associations (prevalence ratios) of continuously measured BMI and waist circumference with prevalent diabetes and hypertension by sex. Pooled estimates across studies were computed by sex and age.
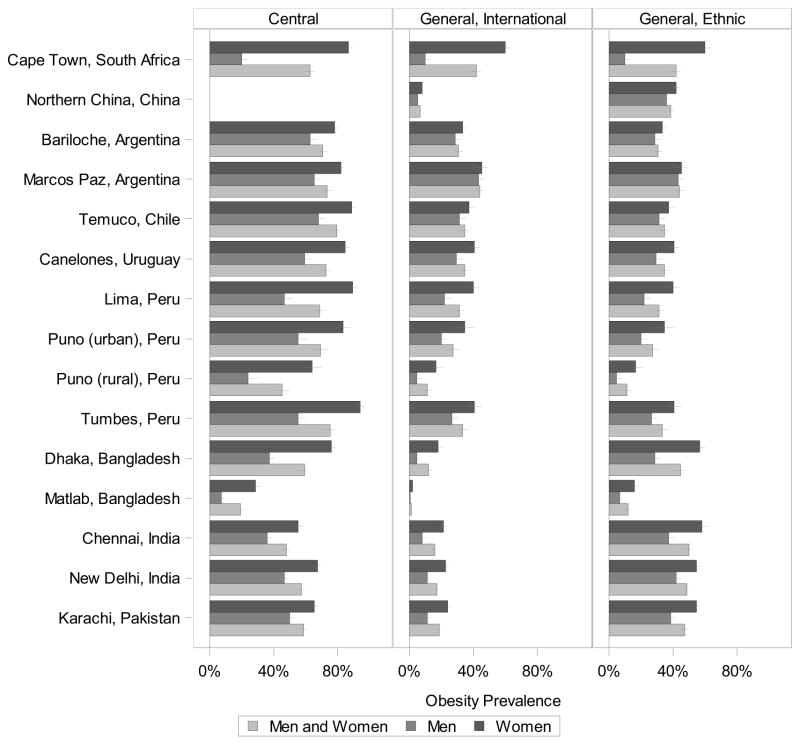
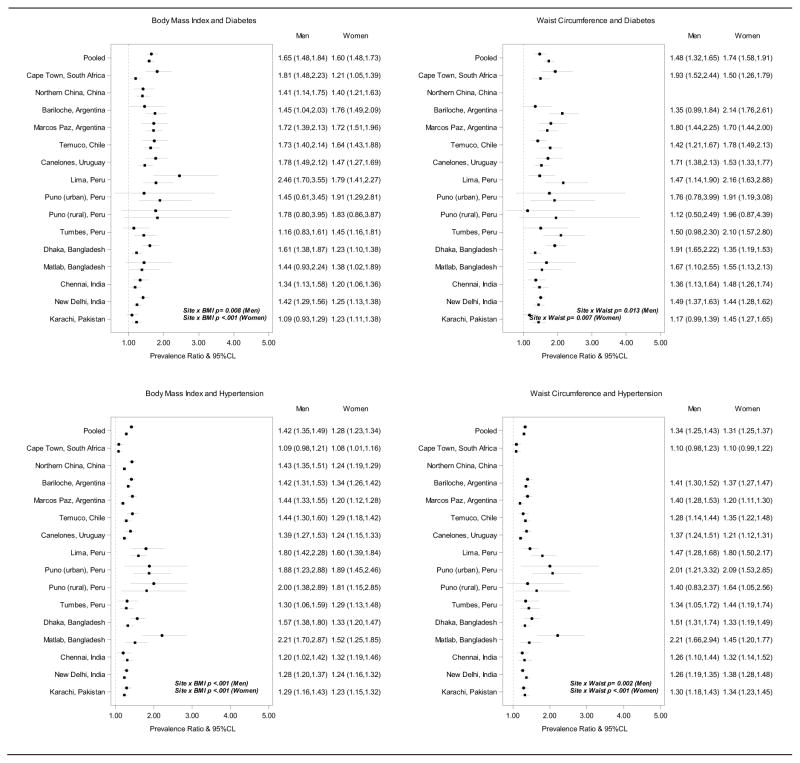
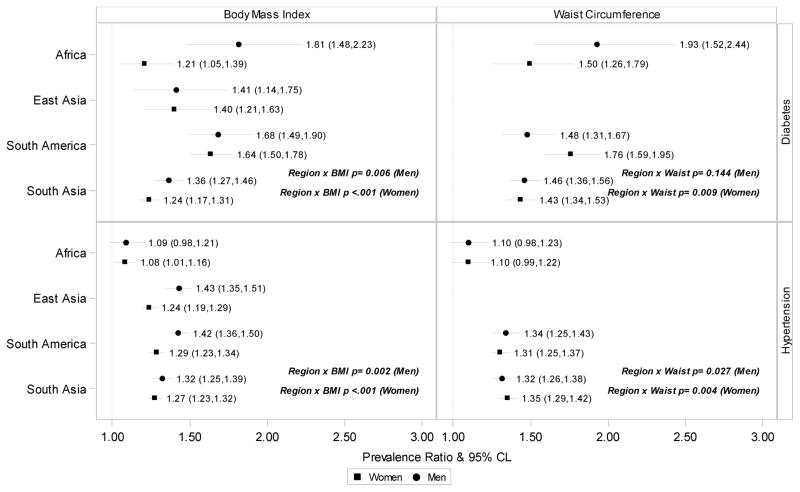
Results: This study analyzed data from 31,118 participants aged 20 to 79 years. General obesity was highest in South Asian cities and central obesity was highest in South America. The proportion classified with general obesity (range 11% to 50%) tended to be lower than the proportion classified as centrally obese (range 19% to 79%). Every standard deviation higher of BMI was associated with 1.65 and 1.60 times higher probability of diabetes and 1.42 and 1.28 times higher probability of hypertension, for men and women, respectively, aged 40 to 69 years. Every standard deviation higher of waist circumference was associated with 1.48 and 1.74 times higher probability of diabetes and 1.34 and 1.31 times higher probability of hypertension, for men and women, respectively, aged 40 to 69 years. Associations of obesity measures with diabetes were strongest in South Africa among men and in South America among women. Associations with hypertension were weakest in South Africa among both sexes.
Conclusions: BMI and waist circumference were both reasonable predictors of prevalent diabetes and hypertension. Across diverse ethnicities and settings, BMI and waist circumference remain salient metrics of obesity that can identify those with increased cardiovascular risk.
Copyright © 2016 World Heart Federation (Geneva). Published by Elsevier B.V. All rights reserved.
Figures

References
-
- Finucane MM, Stevens GA, Cowan MJ, Danaei G, Lin JK, Paciorek CJ, et al. National, regional, and global trends in body-mass index since 1980: systematic analysis of health examination surveys and epidemiological studies with 960 country-years and 9·1 million participants. The Lancet. 2011;377:557–67. doi: 10.1016/S0140-6736(10)62037-5. - DOI - PMC - PubMed
Publication types
MeSH terms
Grants and funding
LinkOut - more resources
Full Text Sources
Other Literature Sources
Medical