. 2016 Apr 21;8(1):44.
doi: 10.1186/s13073-016-0293-0.

Ultra-deep and quantitative saliva proteome reveals dynamics of the oral microbiome

Affiliations

Ultra-deep and quantitative saliva proteome reveals dynamics of the oral microbiome

Niklas Grassl et al. Genome Med. .

Abstract

Background: The oral cavity is home to one of the most diverse microbial communities of the human body and a major entry portal for pathogens. Its homeostasis is maintained by saliva, which fulfills key functions including lubrication of food, pre-digestion, and bacterial defense. Consequently, disruptions in saliva secretion and changes in the oral microbiome contribute to conditions such as tooth decay and respiratory tract infections. Here we set out to quantitatively map the saliva proteome in great depth with a rapid and in-depth mass spectrometry-based proteomics workflow.

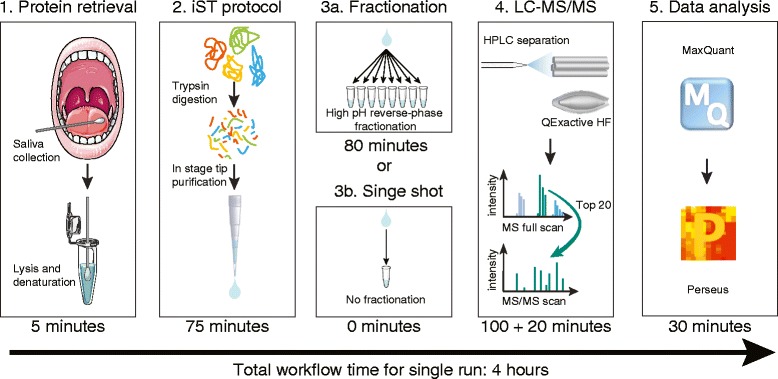
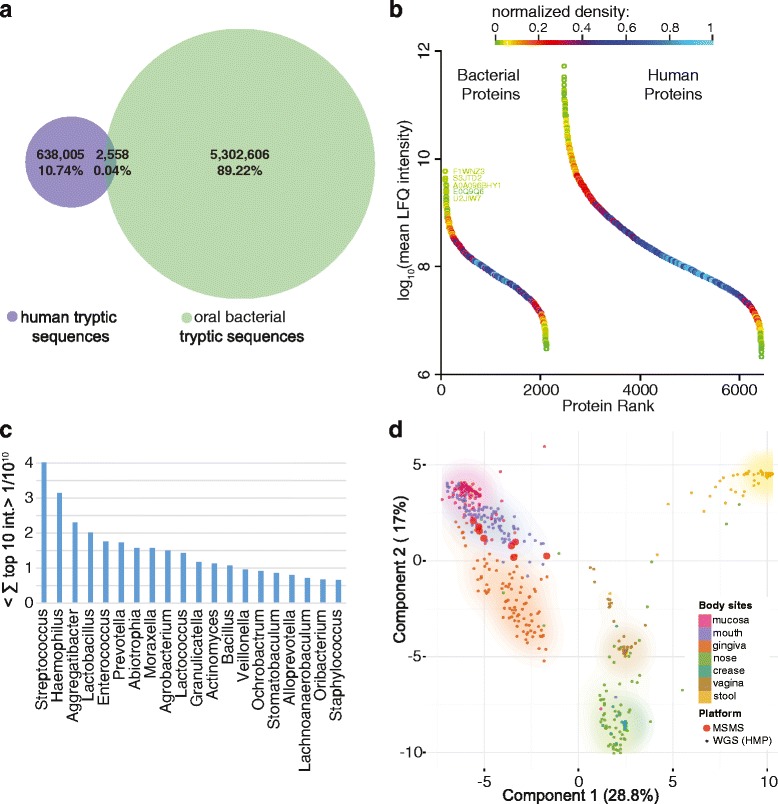
Methods: We used recent improvements in mass spectrometry (MS)-based proteomics to develop a rapid workflow for mapping the saliva proteome quantitatively and at great depth. Standard clinical cotton swabs were used to collect saliva form eight healthy individuals at two different time points, allowing us to study inter-individual differences and interday changes of the saliva proteome. To accurately identify microbial proteins, we developed a method called "split by taxonomy id" that prevents peptides shared by humans and bacteria or between different bacterial phyla to contribute to protein identification.

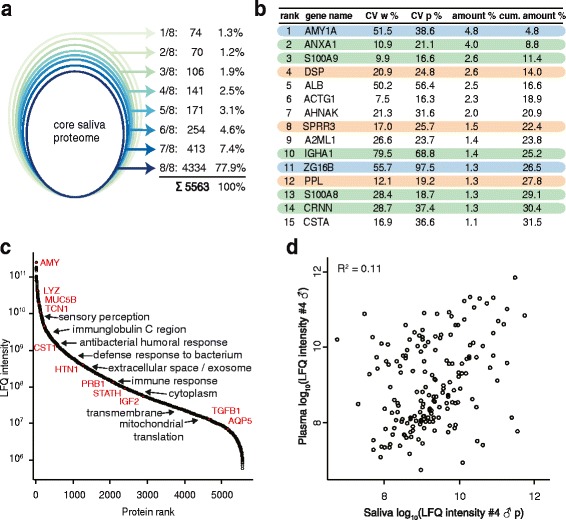
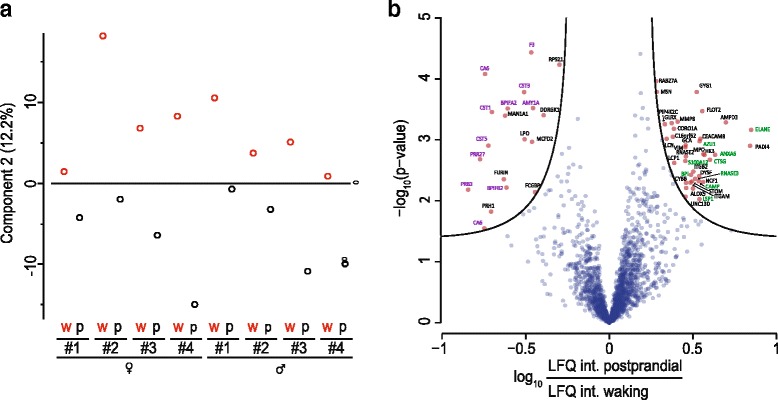
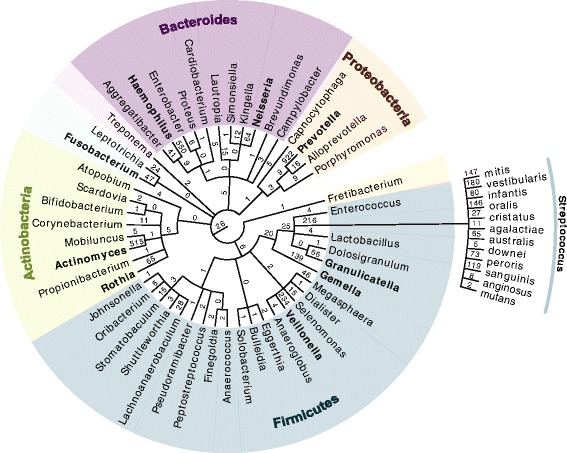
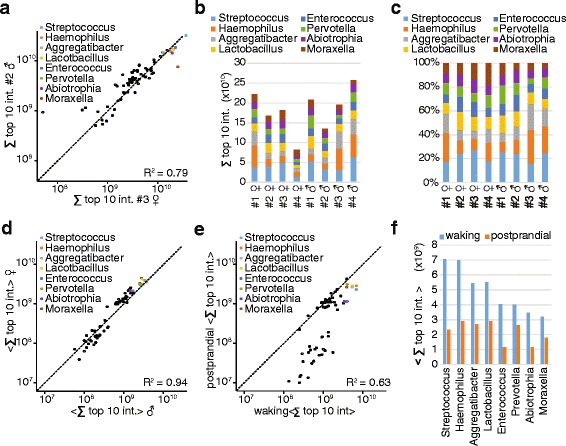
Results: Microgram protein amounts retrieved from cotton swabs resulted in more than 3700 quantified human proteins in 100-min gradients or 5500 proteins after simple fractionation. Remarkably, our measurements also quantified more than 2000 microbial proteins from 50 bacterial genera. Co-analysis of the proteomics results with next-generation sequencing data from the Human Microbiome Project as well as a comparison to MALDI-TOF mass spectrometry on microbial cultures revealed strong agreement. The oral microbiome differs between individuals and changes drastically upon eating and tooth brushing.

Conclusion: Rapid shotgun and robust technology can now simultaneously characterize the human and microbiome contributions to the proteome of a body fluid and is therefore a valuable complement to genomic studies. This opens new frontiers for the study of host-pathogen interactions and clinical saliva diagnostics.


Figures

Fig. 1
Fig. 1
Workflow for ultra-deep and quantitative saliva proteomics. (1, 2) Saliva is collected with a sterile cotton swab and its proteins are denatured, digested, and purified according to the iST protocol [12]. (3) Depending on the desired proteome depth, samples are either separated into eight fractions or directly measured in single runs. (4) Peptides are measured by liquid chromatography–tandem mass spectrometry (LC-MS/MS). (5) MaxQuant identifies and quantifies the proteins and enables statistical analysis in the Perseus software environment. The required time for each of the steps is indicated below each panel
Fig. 2
Fig. 2
Deep human saliva proteomes of eight healthy donors. a Ovals represent the number of saliva proteins shared by the respective number of donors. The outer oval contains all proteins that were detected in at least one donor, whereas the inner oval contains all proteins found in each sample—the core proteome. The numbers on the right indicate the numbers of proteins exactly found in one donor, in two donors, and so on. b Gene names of the 15 most abundant saliva proteins, their coefficients of variation (CVs) across eight donors at waking (w) and after breakfast and tooth brushing (p), as well as their abundances in percentage of the total proteome and the cumulative protein abundances (cum. amount). The proteins in blue are digestive proteins, the proteins in green are part of immune defense, and the proteins in red are of epithelial origin. c Dynamic range plot of the saliva proteome with some key proteins in saliva highlighted in red. Significantly enriched GO terms or Uniprot keywords in specific abundance regions as determined by 1D annotation are listed. d Scatter plot of the LFQ intensities of the saliva proteome and the plasma proteome
Fig. 3
Fig. 3
Intraday dynamics of the human saliva proteome. a PCA of the 16 saliva samples showing that component 2 separates samples based on the collection time (w = waking and p = postprandial). b Differentially regulated proteins between w and p as determined by plotting the t-test significance (5 % permutation-based FDR) versus the logarithmized fold change of LFQ intensity (volcano plot). Protein data points are labeled by their gene names. The green gene names indicate genes with the Uniprot keyword “antibiotic” or “antimicrobial”, the purple gene names indicate proteins with the Uniprot keyword “secreted”
Fig. 4
Fig. 4
Taxonomy tree of 50 bacterial genera with evidence at the peptide level. The number of peptides that were specifically attributable to this position on the taxonomic tree are given above the edges of the graph. Genera in bold were also detected after bacterial culture of the saliva samples followed by MALDI-TOF MS measurement. For the genus Streptococcus the tree is extended down to the species level
Fig. 5
Fig. 5
Quantitative distribution of bacterial proteins. a Number of nonredundant tryptic sequences considered in our MaxQuant search space for human (violet) and oral (green) bacteria. The percentage of shared peptides between human and bacteria among all nonredundant peptides in our search is 0.04 %. b Dynamic range plot of the saliva proteome searched against a combined human and bacterial sequence database. The protein density is color coded and the names of the most abundant proteins are given. c The sum of the top ten peptide intensities per genus serves as a quantitative measure of genus abundance. The 20 most abundant genera are depicted. d PCA of whole genome sequencing (WGS) data from the human microbiome project (HMP) co-analyzed with our saliva proteome data (MSMS). The MS-based proteomics data (MSMS) tightly co-localizes with the mouth sites from the human microbiome project
Fig. 6
Fig. 6
Bacterial composition across donors and time points. a Typical scatter plot for two donors of the bacterial genera quantified by the sum of their top ten peptide intensities from fractionated proteome measurements. The eight most abundant genera are color coded. b Absolute quantification of the eight most abundant bacterial species depicted for each individual donor and (c) normalized to 100 %. d Mean genus quantities between males and females treated as groups from single run measurements. e Comparison of mean bacterial abundances at waking to the mean bacterial abundances in the postprandial state. f Reduction in bacterial abundance between the waking saliva samples and the postprandial samples

References

    1. Shpitzer T, Hamzany Y, Bahar G, Feinmesser R, Savulescu D, Borovoi I, et al. Salivary analysis of oral cancer biomarkers. Br J Cancer. 2009;101:1194–8. doi: 10.1038/sj.bjc.6605290. - DOI - PMC - PubMed
    1. Delaleu N, Mydel P, Kwee I, Brun JG, Jonsson MV, Jonsson R. High fidelity between saliva proteomics and the biologic state of salivary glands defines biomarker signatures for primary Sjogren’s syndrome. Arthritis Rheumatol. 2015;67:1084–95. doi: 10.1002/art.39015. - DOI - PubMed
    1. Yoshizawa JM, Schafer CA, Schafer JJ, Farrell JJ, Paster BJ, Wong DT. Salivary biomarkers: toward future clinical and diagnostic utilities. Clin Microbiol Rev. 2013;26:781–91. doi: 10.1128/CMR.00021-13. - DOI - PMC - PubMed
    1. Bandhakavi S, Stone MD, Onsongo G, Van Riper SK, Griffin TJ. A dynamic range compression and three-dimensional peptide fractionation analysis platform expands proteome coverage and the diagnostic potential of whole saliva. J Proteome Res. 2009;8:5590–600. doi: 10.1021/pr900675w. - DOI - PMC - PubMed
    1. Ding T, Schloss PD. Dynamics and associations of microbial community types across the human body. Nature. 2014;509:357–60. doi: 10.1038/nature13178. - DOI - PMC - PubMed

Publication types

MeSH terms