. 2016 Apr 22;352(6284):aaf0659.
doi: 10.1126/science.aaf0659.

Detyrosinated microtubules buckle and bear load in contracting cardiomyocytes

Affiliations

Detyrosinated microtubules buckle and bear load in contracting cardiomyocytes

Patrick Robison et al. Science. .

Abstract

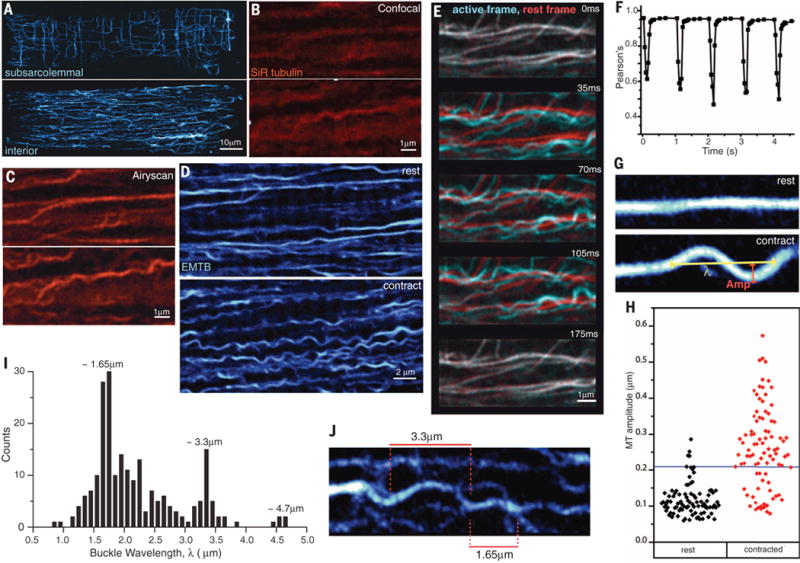
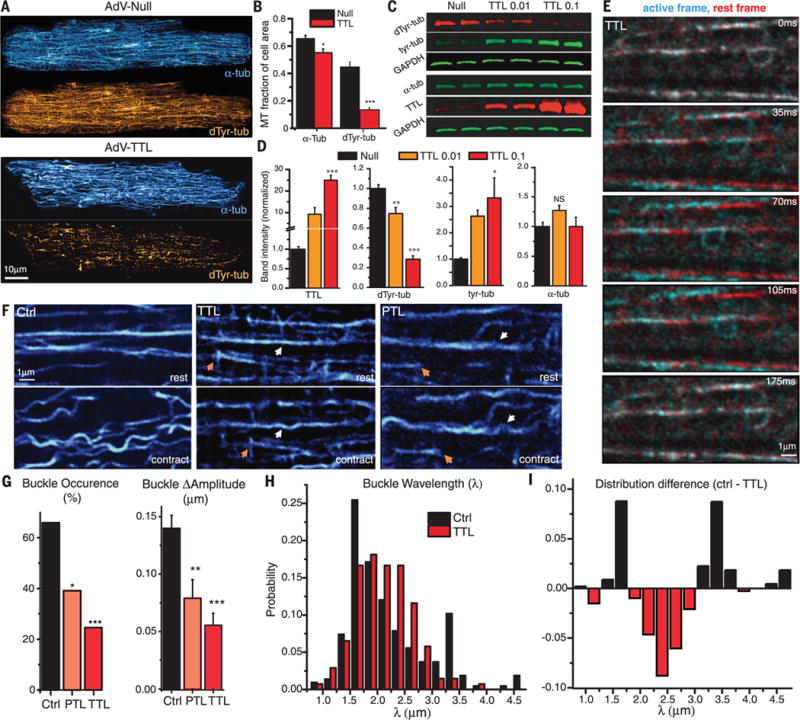
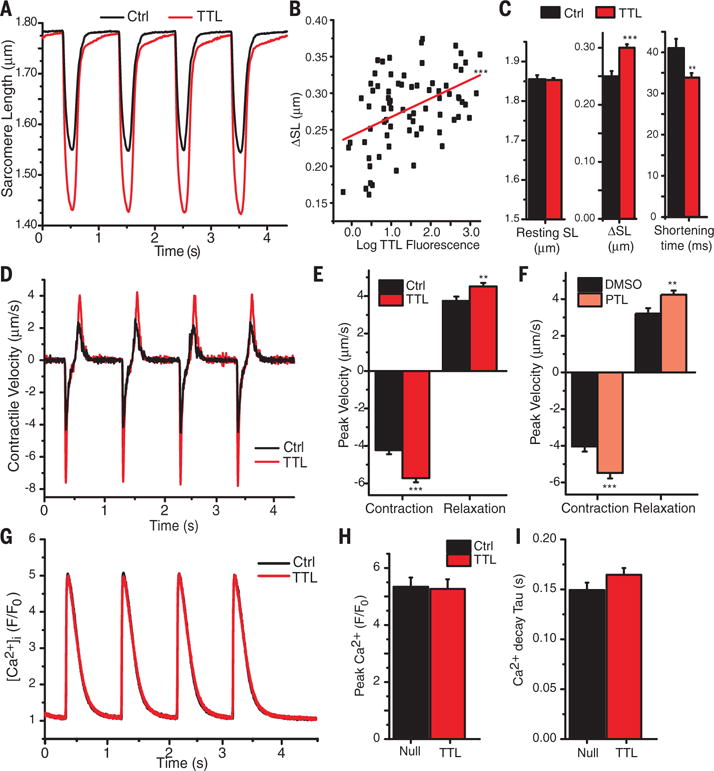
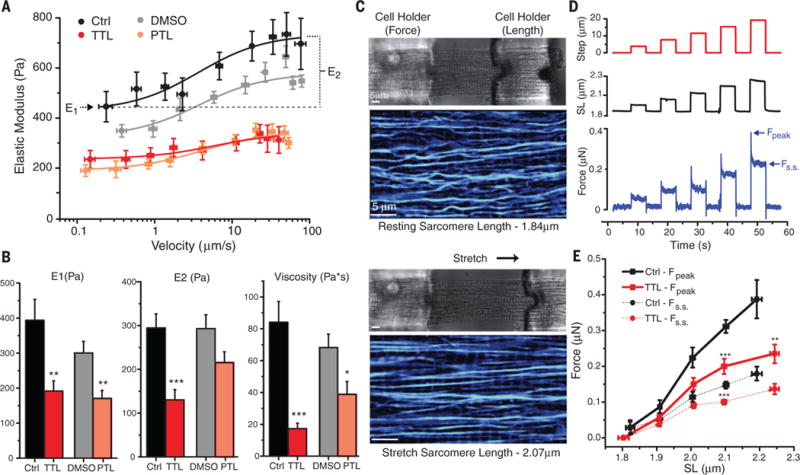
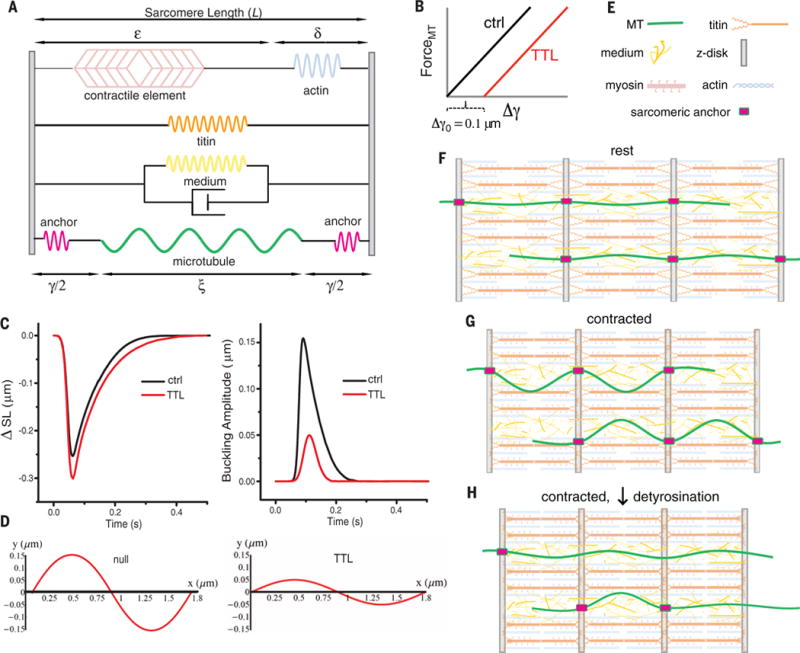
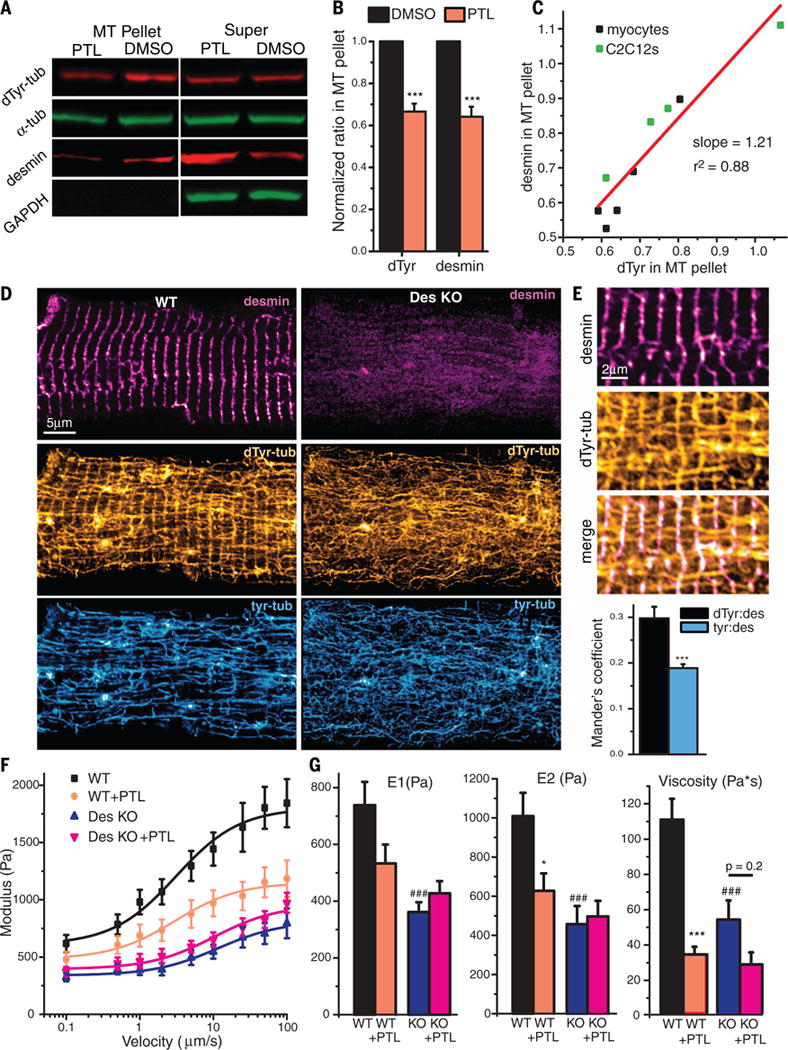
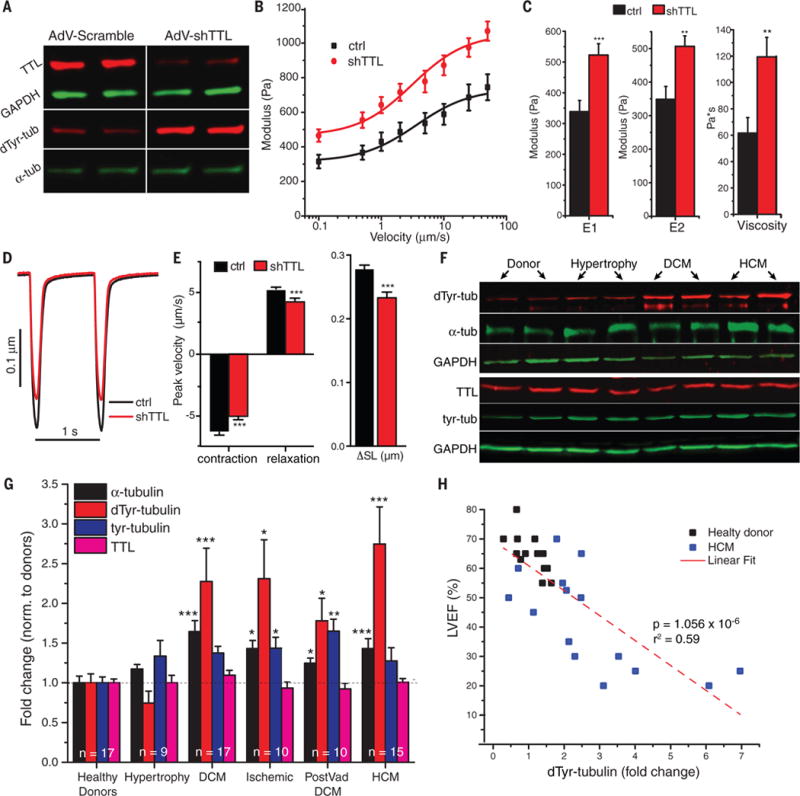
The microtubule (MT) cytoskeleton can transmit mechanical signals and resist compression in contracting cardiomyocytes. How MTs perform these roles remains unclear because of difficulties in observing MTs during the rapid contractile cycle. Here, we used high spatial and temporal resolution imaging to characterize MT behavior in beating mouse myocytes. MTs deformed under contractile load into sinusoidal buckles, a behavior dependent on posttranslational "detyrosination" of α-tubulin. Detyrosinated MTs associated with desmin at force-generating sarcomeres. When detyrosination was reduced, MTs uncoupled from sarcomeres and buckled less during contraction, which allowed sarcomeres to shorten and stretch with less resistance. Conversely, increased detyrosination promoted MT buckling, stiffened the myocyte, and correlated with impaired function in cardiomyopathy. Thus, detyrosinated MTs represent tunable, compression-resistant elements that may impair cardiac function in disease.


Figures

Fig. 1
Fig. 1. MTs reversibly buckle in contracting cardiomyocytes
(A) The subsurface (top) and interior (bottom) cardiomyocyte MT network. (B) High-speed confocal imaging of MTs at rest (top) and during contraction (bottom) labeled with SiR tubulin with brightness increased for comparison with (C). (C) Airyscan imaging of the same MTs as in (B) at rest and during contraction. (D) Wider view of MTs labeled with EMTB-3xGFP at rest (top) and during contraction (bottom). (E) MTs imaged throughout a contractile cycle (cyan) were overlaid onto the network configuration from the initial frame at rest (red). (F) Colocalization analysis of (E) shows that MTs repeatedly return to the same position. Pearson’s coefficient is used to estimate goodness of fit to original MT configuration over several contractile cycles. Initial drop to ~0.96 is due to imaging noise. (G) Quantification of buckling amplitude (measured from centerline to edge) and λ (wavelength measured as twice the distance between consecutive inflection points). (H) Amplitude of MTs labeled with EMTB-3xGFP in resting (black) and contracted (red) cardiomyocytes. The threshold to determine buckling occurrence (blue line) was two standard deviations above the mean resting value. (I) Distribution of buckling wavelengths in cardiomyocytes shows a dominant population between 1.6 and 1.7 μm, and a second population at 3.3 μm. (J) A representative MT demonstrating buckles with wavelengths that correspond to the distance between one (1.65 μm) or two (3.3 μm) adjacent sarcomeres.
Fig. 2
Fig. 2. Detyrosination underlies MT buckling
(A) The MT cytoskeleton (blue and aqua) in rat adult cardiomyocytes (top) is heavily detyrosinated (orange).TTL overexpression (bottom) reduces detyrosination dramatically but makes comparatively small changes in the overall MT network. (B) Quantification of the fraction of cell area covered by α-tubulin and detyrosinated tubulin (dTyr-tubulin) in null (n = 14) and TTL-overexpressing (n = 13) cells, as determined from thresholded images as shown in fig. S2E. (C and D) Western blots from cardiomyocyte lysates show the effects of viral overexpression of TTL. GAPDH, glyceraldehyde-3-phosphate dehydrogenase. (E) Time course of MTs in a contracting cardiomyocyte (cyan) transduced with AdV-TTL overlaid on the resting MT configuration (red). MTs appear to translocate along the contractile axis rather than deforming. (F) Comparison of MTs in resting (top) and contracted (bottom) cardiomyocytes in control, TTL, and PTL groups. In TTL and PTL groups, some MTs slide (orange arrows) relative to others that deform (white arrows). Additional examples are provided in fig. S3. (G) Buckling occurrence and amplitude are reduced by overexpression of TTL or treatment with PTL. (H) Buckling wavelength distribution in control and TTL-overexpressing myocytes and (I) the difference between these distributions. Overexpression of TTL causes MTs to buckle more often at wavelengths between 2 and 3 μm, and MTs are far less likely to buckle at distinct sarcomeric wavelengths (1.7 and 3.3 μm) when detyrosination is reduced. Data are presented as means ± SEM; *P < 0.05, **P < 0.01, ***P < 0.001. Further statistical details are available in table S1.
Fig. 3
Fig. 3. Detyrosinated MTs impede contractility
(A) Sarcomere shortening (DSL) during contraction is increased in TTL-overexpressing myocytes. This change is (B) dose-dependent [P = 1.2 × 10⁻⁵, correlation coefficient (r2) = 0.23] and (C) associated with a faster shortening time without affecting resting sarcomere length. (D) First derivative of traces in (A) demonstrate contractile velocities in control and TTL-overexpressing myocytes. (E) TTL-overexpressing myocytes demonstrate an increase in the peak velocityof both contraction and relaxation. (F) PTL-treated cells display similar behavior. (G to I) Despite the significant changes in contractility, no changes in the peak or kinetics of the global calcium transient were observable. F/F0, the change in fluorescence from the original fluorescence before stimulation. Data are presented as means ± SEM; *P < 0.05, **P < 0.01, ***P < 0.001. Further statistical details are available in table S2.
Fig. 4
Fig. 4. Detyrosinated MTs regulate the viscoelasticity of cardiomyocytes
(A) Elastic modulus of cardiomyocytes measured by AFM at various indentation velocities and fit to SLSM (see methods in SM). (B) Quantification of velocity-independent (E1) and velocity-dependent (E2) components of the elastic modulus, and SLSM fit–derived viscosity. Both TTL overexpression and PTL treatment significantly reduced elasticity and viscosity. There were no significant differences in these parameters between dimethyl sulfoxide (DMSO) (gray) and AdV-null (black) transduced cells (P = 0.28, 0.34, and 0.33, respectively). Reductions in stiffness due to TTL overexpression are also apparent in cells under stretch along the longitudinal axis. (C) Myocytes were attached via glass cell holders (C, top, and fig. S5) to a force transducer and length controller and were subjected to stretch. MTs visualized by EMTB-3xGFP (C, blue and aqua) at rest (top) and at a stretched length (bottom). (D) Representative force versus length protocol. A series of stepwise stretches (red) in 4-μm increments are applied to an isolated myocyte, which increases sarcomere length (SL, black). Passive tension (blue) generated by the step relaxes quickly from a peak value to a new steady state. (E) Force measurements binned according to measured change in sarcomere length with a given step size. TTL-overexpressing cells exert reduced peak passive tension during step changes in length, with a more modest reduction in steady-state tension. Data are presented as means ± SEM; *P < 0.05, **P < 0.01, ***P < 0.001. Further statistical details are available in tables S3 and S4.
Fig. 5
Fig. 5. Modeling MTs in the contracting sarcomere
(A) Mechanical schematic of the modeled sarcomere. A force-generating contractile arm (top) is coupled in parallel at the Z-disc to a spring element representing titin (orange), a viscoelastic medium (yellow spring and dashpot), and a MT (green) with anchors (fuschia pink) to the Z-disc (gray). The anchor to the Z-disc is only engaged at regions of MT detyrosination. (B) TTL overexpression is modeled by allowing the anchors to slide for 50 nm at each end before engaging and transmitting force to the MT at a detyrosinated subunit. (C) The change in sarcomere length at peak contraction and buckling amplitude. (C) and (D) recapitulate experimental observations for TTL-overexpressing myocytes after this change. (E and F) The cardiac sarcomere, shown with MTs with putative stiff anchors to the sarcomere, here, at the Z-disc. Contraction reduces the distance between anchor points, which requires the MTs either to buckle (G) if the anchors are engaged or to slide (H), if the anchors are not engaged and force incident on the MT remains low. Mathematical model parameters are available in table S5.
Fig. 6
Fig. 6. Desmin associates with detyrosinated MTs to increase cardiomyocyte stiffness
(A) MT cosedimentation shows the interaction between polymerized MTs (pellet) and desmin. (B) Quantification of the amount of detyrosination and desmin (relative to the total amount of tubulin) in the MT pellet from cardiomyocyte lysates with and without PTL treatment. Data were normalized to DMSO level. (C) The amount of desmin associated with the MTs after PTL treatment is directly proportional to the amount of MT detyrosination across several experiments in rat cardiomyocytes and C2C12 cells. (D) Immunofluorescence of desmin, dTyr, and Tyr-tubulin shows dTyr-specific transverse pattern in WT, but not desmin KO, myocytes. (E) Overlay of dTyr-tubulin and desmin. (See fig. S7 for more examples.) (F and G) AFM measurements show a PTL-dependent reduction in myocyte stiffness and viscosity in WT, but not desmin, KO myocytes. Viscoelasticity in desmin KO myocytes is not statistically different from WT with PTL treatment. Data are presented as means ± SEM; *P < 0.05, **P < 0.01, ***P < 0.001 with respect to DMSO treatment; ###P < 0.001 with respect to untreated WT myocytes. Further statistical details are available in table S6.
Fig. 7
Fig. 7. Increasing detyrosination impairs contraction and is associated with human heart failure
(A) Western blot shows that shRNA against TTL selectively increases dTyr-tubulin without changing overall levels of α-tubulin. (B) Elastic modulus of control and shTTL-expressing myocytes at various indentation rates. (C) shTTL myocytes demonstrate increases in E1, E2, and viscosity. (D and E) TTL suppression significantly reduces contractile magnitude and velocity. (F) Representative Western blots from human heart lysates. (G) Data from pooled analysis; n = 17 healthy donors, 9 hypertrophy, 17 DCM, 11 ischemic, 10 with DCM following ventricular assist device support (VAD DCM), and 15 HCM hearts. (H) There was a negative correlation between LVEF and dTyr-tubulin expression in control and hypertrophic cardiomyopathy patients. Data are presented as means ± SEM; *P < 0.05, **P < 0.01, ***P < 0.001. Further statistical details are available in tables S7 to S9.

Comment in

  • Cytoskeleton: Microtubules set the beat.
    Strzyz P. Strzyz P. Nat Rev Mol Cell Biol. 2016 Jun;17(6):333. doi: 10.1038/nrm.2016.63. Epub 2016 May 11. Nat Rev Mol Cell Biol. 2016. PMID: 27165791 No abstract available.

References

    1. Prosser BL, Ward CW, Lederer WJ. X-ROS signaling: Rapid mechano-chemo transduction in heart. Science. 2011;333:1440–1445. doi: 10.1126/science.1202768. - DOI - PubMed
    1. Prosser BL, Ward CW, Lederer WJ. X-ROS signaling is enhanced and graded by cyclic cardiomyocyte stretch. Cardiovasc Res. 2013;98:307–314. doi: 10.1093/cvr/cvt066. - DOI - PMC - PubMed
    1. Zile MR, et al. Constitutive properties of adult mammalian cardiac muscle cells. Circulation. 1998;98:567–579. doi: 10.1161/01.CIR.98.6.567. - DOI - PubMed
    1. Nishimura S, et al. Microtubules modulate the stiffness of cardiomyocytes against shear stress. Circ Res. 2006;98:81–87. doi: 10.1161/01.RES.0000197785.51819.e8. - DOI - PubMed
    1. Granzier HL, Irving TC. Passive tension in cardiac muscle: Contribution of collagen, titin, microtubules, and intermediate filaments. Biophys J. 1995;68:1027–1044. doi: 10.1016/S0006-34959580278-X. - DOI - PMC - PubMed

Publication types

MeSH terms