. 2016 Apr 22:6:23901.
doi: 10.1038/srep23901.

Clonify: unseeded antibody lineage assignment from next-generation sequencing data

Affiliations

Clonify: unseeded antibody lineage assignment from next-generation sequencing data

Bryan Briney et al. Sci Rep. .

Abstract

Defining the dynamics and maturation processes of antibody clonal lineages is crucial to understanding the humoral response to infection and immunization. Although individual antibody lineages have been previously analyzed in isolation, these studies provide only a narrow view of the total antibody response. Comprehensive study of antibody lineages has been limited by the lack of an accurate clonal lineage assignment algorithm capable of operating on next-generation sequencing datasets. To address this shortcoming, we developed Clonify, which is able to perform unseeded lineage assignment on very large sets of antibody sequences. Application of Clonify to IgG+ memory repertoires from healthy individuals revealed a surprising lack of influence of large extended lineages on the overall repertoire composition, indicating that this composition is driven less by the order and frequency of pathogen encounters than previously thought. Clonify is freely available at www.github.com/briney/clonify-python.


Figures

Figure 1
Figure 1. Error and bias correction using unique antibody identifiers (UAIDs).
(A) Separately for each donor, raw antibody sequences were binned by UAID and the size of each UAID bin was determined. Shown is a histogram of bin sizes, with each donor represented by a single, semi-transparent plot. (B) Force-directed network plots of ‘lineages’ built from raw sequences drawn from a single UAID bin. Each plot represents a single UAID bin, and one UAID bin per donor is shown. As the sequences in each network plot were taken from a single UAID bin, they represent multiple reads of the same RNA transcript. Therefore, the sequence diversity in each of the plots is due entirely to sequencing and amplification error.
Figure 2
Figure 2. The Clonify algorithm for antibody lineage assignment.
(A) Schematic of the Clonify algorithm, which consists of two major parts: the calculation of an antibody-specific edit distance for each sequence pair and the assembly of these scores into a pairwise distance matrix, followed by hierarchical clustering of the antibody sequences. (B) Separately for each of the eight donors, 1000 sequences were randomly selected and the pairwise distance was calculated for each sequence pair. Performing all-versus-all comparisons on 1000 sequences results in the computation of 499,500 pairwise distance scores. The frequency of each distance score is shown (the X-axis is truncated at 3.0 for clarity). The trough in score frequencies, which was used to assign the clustering threshold, is indicated. (C) Clonify was used to group a panel of HIV broadly neutralizing antibody (bnAb) sequences into clonal lineages. The pairwise distances computed by Clonify were used to create a distance matrix, with dark grey indicating high similarity (low distance score). Known clonal lineages are indicated by color on the top and left sides of the distance matrix and known singletons (sequences without any clonal relatives in the bnAb panel) are all colored light grey. Sequences were clustered by Clonify score, and the resulting dendrogram is shown above the distance matrix. The clonality threshold is indicated with a dashed line across the clustering dendrogram.
Figure 3
Figure 3. Accuracy of the Clonify algorithm.
(A) For each donor, either 1000 or 7000 sequences were randomly selected and assigned to lineages. The clonality of each sample was determined, which represents the frequency of sequences belonging to a lineage with at least two members. Eight sequence pools were then constructed, containing 1000 randomly selected sequences from seven of the eight donors such that each donor was left out of a single pool. Lineages were assigned and the level of clonality was determined for each pool. The mean clonality for the multi-donor sequence pools was statistically indistinguishable from the single donor sequence sets containing 1000 sequences. Clonality of single donor sequence sets containing 7000 sequences was found to be significantly higher than both the single donor sequence sets with 1000 sequences (P < 0.0001) and the multi-donor pools (p < 0.0001) by two-tailed Student’s T-test. (B,C) Multi-donor sequence pools of increasing size were created by randomly selecting an equal number of sequences from each donor. Lineages were iteratively assigned for each multi-donor pool, and the frequency of ‘incorrect’ assignments, which we define as sequences assigned to a lineage containing primarily sequences from a different donor, was calculated. The frequency of ‘correct’ and ‘incorrect’ assignments is shown in (C). The frequency of short HCDR3 regions (<15 amino acids) was calculated for the ‘correct’ and ‘incorrectly’ assigned sequences for each donor (B). Incorrectly assigned sequences encoded significantly shorter HCDR3s than did correctly assigned sequences (p < 0.0001, two-tailed Student’s T-test).
Figure 4
Figure 4. Comparison of unseeded lineage assignment algorithms.
(A) HIV bnAb sequences were assigned to lineages with each of 6 algorithms. Antibody sequences that were correctly assigned are indicated with blue squares, incorrectly assigned sequences are gray. (B) For each algorithm, correctly assigned lineages (lineages for which every antibody is correctly assigned) are indicated in blue, incorrect lineages are indicated in gray. (C) For each unseeded lineage assignment algorithm, the frequency of sequences assigned to lineages containing sequences from multiple donors (‘incorrect’ sequences) is shown.
Figure 5
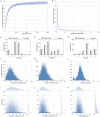
Figure 5. Lineage assignments on the IgG+ memory population of eight healthy donors.
(A) Separately for each donor, increasing numbers of error-corrected sequences were selected, lineages were assigned, and the frequency of sequences belonging to a lineage with at least two members was calculated. The clonal sequence frequency was plotted, with the dark line indicating the mean clonality of all eight donors, and increasingly transparent bands indicating 1 or 2 standard deviations. (B) Using all error-corrected sequences from each donor, lineages were assigned and the size of each lineage was calculated. Lineage size frequencies were then plotted, with the dark line indicating the mean for all eight donors, and the transparent bands representing 1 or 2 standard deviations (in this plot, it is virtually impossible to identify the band that represents 1 SD). Variable (C) and diversity (D) gene family and joining (E) gene use were determined for all sequences (counting each sequence once) and for all lineages (counting each lineage only once, regardless of size). Plots represent the mean ±SEM for each of the eight donors. No significant differences in gene use between sequences and lineages were observed (ANOVA). Lineages were binned by average nucleotide mutation count (F), average amino acid mutation count (G) and HCDR3 length (H), counting each lineage only once. Histograms displaying the lineage frequency for each of the above characteristics were plotted, with lineages from each donor represented as a single, semi-transparent plot. Lineage size was then plotted against three genetic features: average nucleotide mutation count (I), average amino acid mutation count (J) and HCDR3 length (K). No statistically significant correlation was observed between lineage size and any of the three genetic features that were tested (ANOVA).

References

    1. Sok D. et al.. The Effects of Somatic Hypermutation on Neutralization and Binding in the PGT121 Family of Broadly Neutralizing HIV Antibodies. PLoS Pathog 9, e1003754 (2013). - PMC - PubMed
    1. Finn J. A. & Crowe J. E. Impact of new sequencing technologies on studies of the human B cell repertoire. Curr Opin Immunol 25, 613–618 (2013). - PMC - PubMed
    1. Georgiou G. et al.. The promise and challenge of high-throughput sequencing of the antibody repertoire. Nature biotechnology 32, 158–168 (2014). - PMC - PubMed
    1. Koff W. C. et al.. Accelerating next-generation vaccine development for global disease prevention. Science 340, 1232910 (2013). - PMC - PubMed
    1. Koff W. C., Gust I. D. & Plotkin S. A. Toward a human vaccines project. Nat Immunol 15, 589–592 (2014). - PubMed

Publication types