. 2016 Jul;26(7):3285-96.
doi: 10.1093/cercor/bhw089. Epub 2016 Apr 21.

Network-Level Structure-Function Relationships in Human Neocortex

Affiliations

Network-Level Structure-Function Relationships in Human Neocortex

Bratislav Mišić et al. Cereb Cortex. 2016 Jul.

Abstract

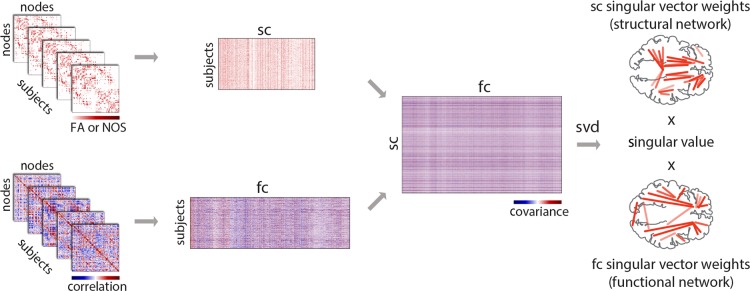
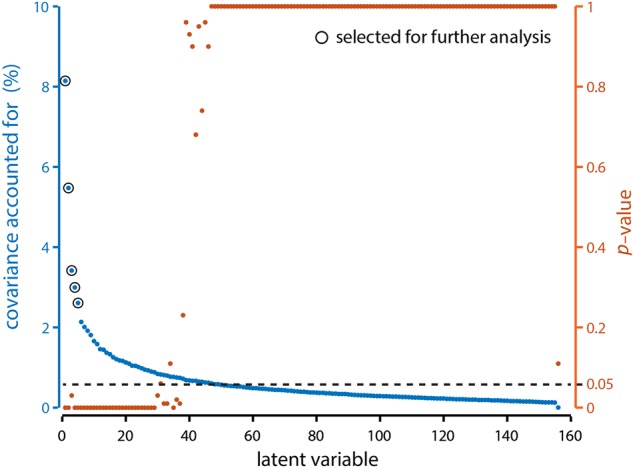
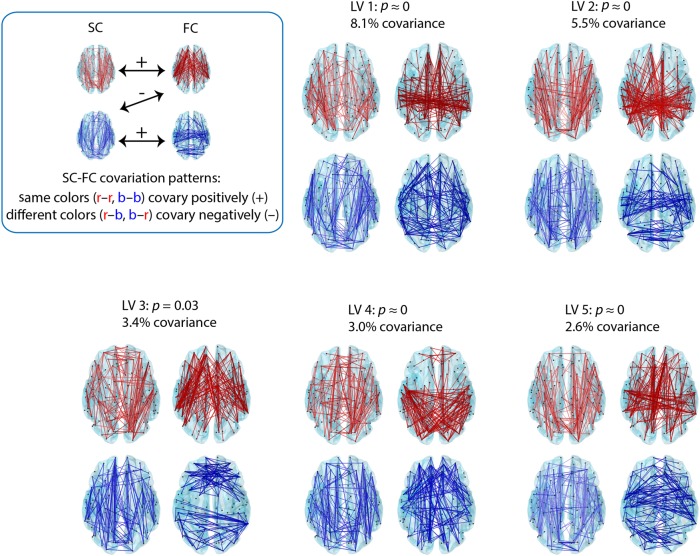
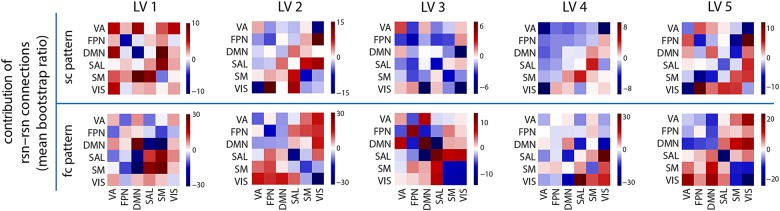
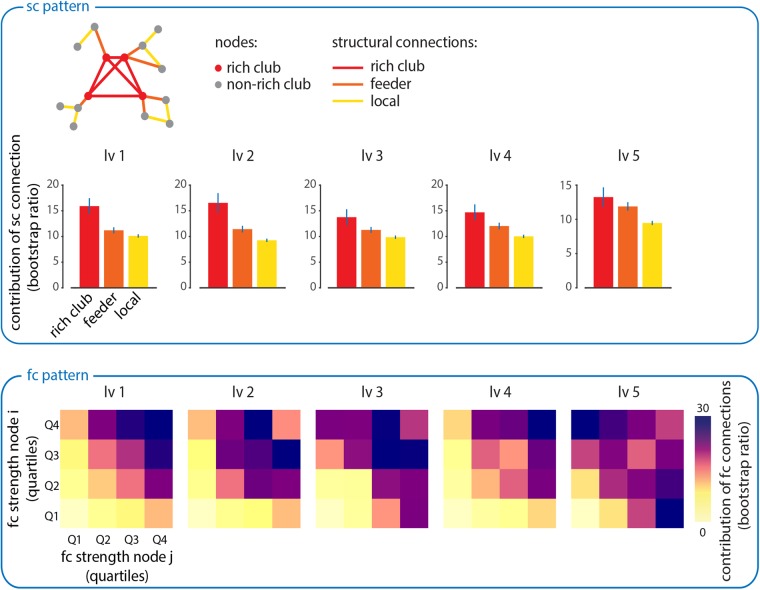
The dynamics of spontaneous fluctuations in neural activity are shaped by underlying patterns of anatomical connectivity. While numerous studies have demonstrated edge-wise correspondence between structural and functional connections, much less is known about how large-scale coherent functional network patterns emerge from the topology of structural networks. In the present study, we deploy a multivariate statistical technique, partial least squares, to investigate the association between spatially extended structural networks and functional networks. We find multiple statistically robust patterns, reflecting reliable combinations of structural and functional subnetworks that are optimally associated with one another. Importantly, these patterns generally do not show a one-to-one correspondence between structural and functional edges, but are instead distributed and heterogeneous, with many functional relationships arising from nonoverlapping sets of anatomical connections. We also find that structural connections between high-degree hubs are disproportionately represented, suggesting that these connections are particularly important in establishing coherent functional networks. Altogether, these results demonstrate that the network organization of the cerebral cortex supports the emergence of diverse functional network configurations that often diverge from the underlying anatomical substrate.

Keywords: connectome; multivariate; network; partial least squares.


Figures

Figure 1.
Figure 1.
PLS analysis. SC and FC data matrices were organized by stacking the upper triangle elements from individual participants' matrices to form two new matrices. The rows of these matrices correspond to participants, and columns correspond to either structural or functional connections. Structural connections that were zero-valued for all participants were removed, and the remaining data were z-scored columnwise. The covariance between structural and functional connections was computed across participants, resulting in a rectangular SC–FC covariance matrix. The SC–FC covariance matrix was then subjected to singular value decomposition (SVD), resulting in a vector of weights for all structural connections (interpreted as a structural network), a vector of weights for all functional connections (interpreted as a functional network) that optimally covary with each other. Each SC–FC pattern was associated with a scalar singular value, which indicates the proportion of SC–FC covariance accounted for by the extracted structural and functional networks.
Figure 2.
Figure 2.
Latent variable magnitudes. The PLS analysis produced k = 156 LVs, each of which represents a particular SC–FC relationship, and is associated with a singular value. The squared magnitude of each singular value is proportional to the strength of the SC–FC relationship. (Blue) percent covariance (i.e., effect size) accounted for by each LV. (Orange) P-value associated with each LV, as determined by permutation tests.
Figure 3.
Figure 3.
Spatial configuration of optimally covarying SC–FC networks. PLS analysis revealed 5 statistically significant SC–FC patterns. Statistical significance is assessed using permutation tests, and effect size is estimated from the magnitude of the singular value associated with each pattern (see Materials and Methods). Each LV is comprised of a weighted pattern of structural (left) and functional (right) connections. Bootstrap resampling is used to construct a 95% confidence interval for each connection weight; the top 5% most reliable connections are shown. Connections with positive weights are shown in red and connections with negative weights are shown in blue. SC–FC patterns with the same color covary positively with each other, while SC–FC with different colors covary negatively.
Figure 4.
Figure 4.
RSN relationships. The 5 SC–FC patterns revealed by PLS are stratified by their RSN membership. The RSNs are abbreviated as follows: ventral attention (VA), frontoparietal network (FPN), default mode network (DMN), salience (SAL), somato-motor (SM), and visual (VIS). The mean contribution (bootstrap ratio) is computed for all within- and between-RSN connections.
Figure 5.
Figure 5.
Hubs shape structure-function relationships. Top: mean reliability for each type of structural connection. Structural connections are stratified according to whether they connect rich club nodes to each other (“rich club”), rich club nodes to non-rich club nodes (“feeder”) or non-rich club nodes to other non-rich club nodes (“local”). This classification system is illustrated in the accompanying schematic. Bottom: all functional connections are plotted as a function of the strength of the participating brain regions (strength is calculated as the mean absolute functional connectivity of an individual region). The strengths of participating nodes are stratified into quartiles and the contribution of all connections in those quartiles is averaged. Each quartile is colored according to how reliably it contributes to the FC pattern derived from the PLS analysis.

References

    1. Abdi H. 2010. Partial least squares regression and projection on latent structure regression (PLS regression). Wiley Interdiscip Rev Comput Stat. 2(1):97–106.
    1. Adachi Y, Osada T, Sporns O, Watanbe T, Matsui T, Miyamoto K, Miyashita Y. 2012. Functional connectivity between anatomically unconnected areas is shaped by collective network-level effects in the macaque cortex. Cereb Cortex. 22(7):1586–1592. - PubMed
    1. Allen E, Damaraju E, Plis S, Erhardt E, Eichele T, Calhoun V. 2012. Tracking whole-brain connectivity dynamics in the resting state. Cereb Cortex. 24(3):663–676. - PMC - PubMed
    1. Bassett D, Porter M, Wymbs N, Grafton S, Carlson J, Mucha P. 2013. Robust detection of dynamic community structure in networks. Chaos. 23(1):013142. - PMC - PubMed
    1. Blondel V, Guillaume J-L, Lambiotte R, Lefebvre E. 2008. Fast unfolding of communities in large networks. J Stat Mech Theory E. 2008(10):P10008.