. 2016 Apr 21;8(1):43.
doi: 10.1186/s13073-016-0299-7.

An expansion of rare lineage intestinal microbes characterizes rheumatoid arthritis

Affiliations

An expansion of rare lineage intestinal microbes characterizes rheumatoid arthritis

Jun Chen et al. Genome Med. .

Abstract

Background: The adaptive immune response in rheumatoid arthritis (RA) is influenced by an interaction between host genetics and environment, particularly the host microbiome. Association of the gut microbiota with various diseases has been reported, though the specific components of the microbiota that affect the host response leading to disease remain unknown. However, there is limited information on the role of gut microbiota in RA. In this study we aimed to define a microbial and metabolite profile that could predict disease status. In addition, we aimed to generate a humanized model of arthritis to confirm the RA-associated microbe.

Methods: To identify an RA biomarker profile, the 16S ribosomal DNA of fecal samples from RA patients, first-degree relatives (to rule out environment/background as confounding factors), and random healthy non-RA controls were sequenced. Analysis of metabolites and their association with specific taxa was performed to investigate a potential mechanistic link. The role of an RA-associated microbe was confirmed using a human epithelial cell line and a humanized mouse model of arthritis.

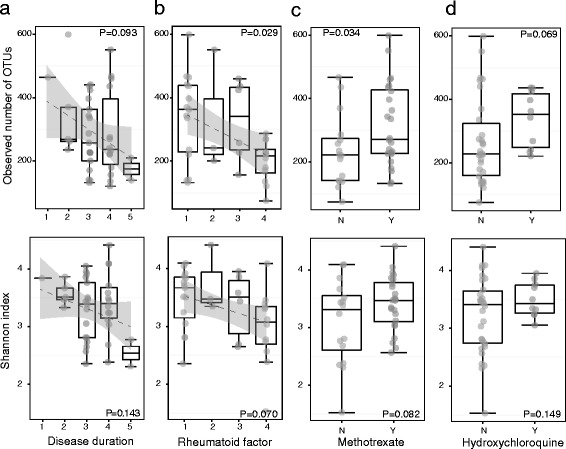
Results: Patients with RA exhibited decreased gut microbial diversity compared with controls, which correlated with disease duration and autoantibody levels. A taxon-level analysis suggested an expansion of rare taxa, Actinobacteria, with a decrease in abundant taxa in patients with RA compared with controls. Prediction models based on the random forests algorithm suggested that three genera, Collinsella, Eggerthella, and Faecalibacterium, segregated with RA. The abundance of Collinsella correlated strongly with high levels of alpha-aminoadipic acid and asparagine as well as production of the proinflammatory cytokine IL-17A. A role for Collinsella in altering gut permeability and disease severity was confirmed in experimental arthritis.

Conclusions: These observations suggest dysbiosis in RA patients resulting from the abundance of certain rare bacterial lineages. A correlation between the intestinal microbiota and metabolic signatures could determine a predictive profile for disease causation and progression.


Figures

Fig. 1
Fig. 1
Disease duration and presence of autoantibodies correlate with α-diversity in rheumatoid arthritis patients. Two α-diversity measures, observed OTU number and Shannon diversity index, were calculated based on the rarefied counts. a, b Duration of arthritis onset (a) and levels of rheumatoid factor autoantibodies (b) in rheumatoid arthritis patients correlate with decreased α-diversity. The dashed line shows the fitted linear regression line with the gray area indicating the 95 % confidence band. Disease duration, 1 = <6 months, 2 = 6 months–1 year, 3 = 1–2 years, 4 = 2–5 years, 5= >5 years. Rheumatoid factor, 1 = <25, 2 = 25–50, 3 = 50–100, 4 = >100. c, d Treatment with methotrexate (c) and hydroxychloroquine (d) correlate with increased α-diversity. N not treated with specific drug, Y treated. The three horizontal lines of each box represent the first, second (median), and third quartile, respectively, with the whisker extending to 1.5 inter-quartile range. n = 40
Fig. 2
Fig. 2
The gut microbiota of RA patients differs from that of controls. a Percentage of 16S reads of major phyla of the gut microbiota of RA patients and controls. b, c Rarefaction curves comparing the species richness (observed OTU numbers) (b) and the overall diversity (Shannon diversity index) (c) of RA patients and controls. The microbiota of RA patients exhibits significantly lower diversity. dg Principal coordinate analysis plot based on the Bray–Curtis distance matrix constructed using OTUs from all phyla (d), Firmicutes (e), Bacteroidetes (f), and Actinobacteria (g). The percentage of variability explained by the corresponding coordinate is indicated on the axis. Each point represents a sample, red symbols indicate RA patients, and blue symbols indicate controls. The blue lines indicate vectors representing the relationships between the OTUs and each sample category. The ellipses serve a visual guide to group differences. PC principal component
Fig. 3
Fig. 3
Patients with RA are characterized by expansion of rare microbial lineages. a, b LefSe analysis was performed to identify differentially abundant taxa, which are highlighted on the phylogenetic tree in cladogram format (a) and for which the LDA scores are shown (b). Red and green colors indicate an increase or decrease in taxa, respectively, in the RA patients compared with controls. Among the identified taxa, the association of the genus Eggerthella was the most significant and remained significant after Bonferroni correction for multiple testing. The genus Faecalibacterium had the largest LDA score. c Representation of the relative abundances of Eggerthella and Faecalibacterium in RA patients, first-degree relatives (FDR) and healthy controls (HC). Each bar represents the abundance of a given sample. Solid and dashed lines indicate mean and median, respectively
Fig. 4
Fig. 4
Prediction model of the gut microbiota for RA status based on the genus-level relative abundances using random forests. a Comparison of the classification error of the random forests-trained model with guessing, which always predicts the class label based on the majority class in the training data set. The boxplots are based on the results from 200 bootstrap samples. Random forests achieved a significantly lower classification error. b Predictive power of individual genera as assessed by the Boruta feature selection algorithm. Blue boxplots correspond to minimal, average, and maximum importance Z scores of shadow genera, which are shuffled versions of real genera introduced to the random forests classifier and provide a benchmark to detect truly predictive genera. Red, yellow and cyan colors show the rejected, tentative, and confirmed genera, respectively, by Boruta selection. Three genera, Eggerthella, Faecalibacterium, and Collinsella, were confirmed by Boruta selection. The genus Collinsella was not identified by univariate tests. c Many RA samples exhibit a large increase in the abundance of Collinsella. Solid and dashed lines indicate mean and median values respectively. d Heat map based on the abundance ranks of the three Boruta-confirmed genera. Red and blue indicate high and low abundance, respectively. Hierarchical clustering (Euclidean distance, complete linkage) shows that RA samples tend to cluster together
Fig. 5
Fig. 5
Association of plasma metabolite levels with RA disease status and gut microbiota. a A principal component analysis revealed that the overall metabolite profile differs between the RA patients and their first-degree relatives (FDR). Each point represents a sample colored by their group membership. The percentage of variance explained by corresponding principal components (PC) are shown on the axes. The direction and length of the blue lines indicates the contribution of the corresponding metabolites to the PCs. The ellipses represent a visual guide to group differences. b Differentially abundant metabolites between RA patients and FDRs (adjusted P < 0.05). The y-axis represents the standardized metabolite level. The error bars indicate the standard error of the mean. c A heat map shows the correlation between the abundances of the three genera Collinsella, Eggerthella, and Faecalibacterium and the differentially abundant metabolites. Colors indicate the Spearman rank correlation (**unadjusted P < 0.01, *P < 0.05, small black squares indicate P < 0.1). The differentially abundant metabolites show strong correlation with the abundance of Collinsella
Fig. 6
Fig. 6
Collinsella aerofaciens enhances arthritis severity. Two weeks post-immunization (marked with arrow) a subset of mice were treated with C. aerofaciens every alternate day for 4 weeks (marked with arrows), n = 10. Mice not treated with C. aerofaciens (n = 8) were used as a control. Mice were followed for a incidence and onset of arthritis (*P = 0.068) and b disease severity. Collinsella enhances T-cell proliferation. c T-cell proliferation was measured by culturing sorted (by fluorescence-activated cell sorting) CD4 cells from the spleens of CII-primed mice cultured with dendritic cells that were pre-cultured with Collinsella for 4 h. **P = 0.02 (n = 3 mice/group). Collinsella reduces the expression of the tight junction protein ZO-1 and Occludin. d CACO-2 cells cultured with or without Collinsella stained with ZO-1 and Occludin showed differences in the expression of tight junction proteins. e Quantification of the mean fluorescence intensity of ZO-1 and Occludin expression in CACO-2 cells cultured alone or in the presence of Collinsella, # P < 0.05 and *P < 0.01. f Increased gut permeability was observed in DQ8 mice when Collinsella was administered. Sera of mice were tested for FITC-Dextran before and after treating mice with Collinsella for 3 weeks (*P = 0.03; n = 10 mice/group). g Fold difference in the expression of Th17 regulatory cytokine/chemokine transcripts in CACO-2 cells cultured with C. aerofaciens compared with CACO-2 cells cultured with bacterial growth media. Error bars represent standard error of the mean values. Experiments were repeated for reproducibility

References

    1. Raychaudhuri S, Sandor C, Stahl EA, Freudenberg J, Lee HS, Jia X, Alfredsson L, Padyukov L, Klareskog L, Worthington J, et al. Five amino acids in three HLA proteins explain most of the association between MHC and seropositive rheumatoid arthritis. Nat Genet. 2012;44:291–6. - PMC - PubMed
    1. Silman AJ, MacGregor AJ, Thomson W, Holligan S, Carthy D, Farhan A, Ollier WE. Twin concordance rates for rheumatoid arthritis: results from a nationwide study. Br J Rheumatol. 1993;32:903–7. - PubMed
    1. Hoovestol RA, Mikuls TR. Environmental exposures and rheumatoid arthritis risk. Curr Rheumatol Rep. 2011;13:431–9. doi: 10.1007/s11926-011-0203-9. - DOI - PubMed
    1. Hitchon CA, El-Gabalawy HS. Infection and rheumatoid arthritis: still an open question. Curr Opin Rheumatol. 2011;23:352–7. doi: 10.1097/BOR.0b013e3283477b7b. - DOI - PubMed
    1. Chu H, Mazmanian SK. Innate immune recognition of the microbiota promotes host-microbial symbiosis. Nat Immunol. 2013;14:668–75. doi: 10.1038/ni.2635. - DOI - PMC - PubMed

Publication types

MeSH terms