. 2016 Apr 22:7:11400.
doi: 10.1038/ncomms11400.

Essential role for a novel population of binucleated mammary epithelial cells in lactation

Affiliations

Essential role for a novel population of binucleated mammary epithelial cells in lactation

Anne C Rios et al. Nat Commun. .

Abstract

The mammary gland represents a unique tissue to study organogenesis as it predominantly develops in the post-natal animal and undergoes dramatic morphogenetic changes during puberty and the reproductive cycle. The physiological function of the mammary gland is to produce milk to sustain the newborn. Here we view the lactating gland through three-dimensional confocal imaging of intact tissue. We observed that the majority of secretory alveolar cells are binucleated. These cells first arise in very late pregnancy due to failure of cytokinesis and are larger than mononucleated cells. Augmented expression of Aurora kinase-A and Polo-like kinase-1 at the lactogenic switch likely mediates the formation of binucleated cells. Our findings demonstrate an important physiological role for polyploid mammary epithelial cells in lactation, and based on their presence in five different species, suggest that binucleated cells evolved to maximize milk production and promote the survival of offspring across all mammalian species.


Figures
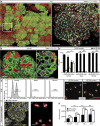
Figure 1
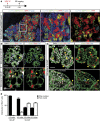
Figure 1. Identification and characterization of binucleated luminal cells in lactating glands.
(a) Whole-mount 3D confocal image of a mammary ductal portion (FVB/N mouse) at 4 dL (left) and optical section of the enlarged region showing an alveolar unit (right). The gland was stained for DAPI (white), E-cadherin (Ecad; green), F-actin (red) and milk (blue, see Supplementary Fig. 1a) (n=3 mice). DAPI staining shows that the vast majority of luminal cells are binucleated. Scale bars: 200 μm (whole-mount); and 40 μm (optical section). (b) Whole-mount 3D confocal image of a mammary ductal portion (FVB/N mouse) at 16.5 dP (left) and optical section showing a representative alveolar unit (right). The gland was stained for DAPI (white), E-cadherin (green) and keratin 5 (red) (n=3 mice). No binucleated cells could be detected. Scale bars: 20 μm. (c) Bar graph showing the percentage of cells containing 2N or 4N DNA content in the luminal (LinCD29loCD24+), basal (LinCD29hiCD24+) and stromal cell (LinCD24) compartments in late pregnancy (16.5 and 18.5 dP) or early lactation (2 dL). Error bars represent mean±s.e.m. (n=3). (d) Representative FACS plots of DNA ploidy in the luminal, basal and stromal populations at 2 dL, and confocal images of sorted cells from the luminal population with 2N or 4N DNA content (far right panels). (e) Optical section from a 3D image of a mammary gland at 4 dL to illustrate the first step in volume quantification. Using ImageJ software, the cell membranes were outlined (yellow) based on E-cadherin immunostaining. Scale bar: 20 μm. (f) 3D image of representative bi- and mononucleated cells used for volume quantification performed with Imaris software. Scale bar: 20 μm. (g) Bar graph showing volume for luminal cells with either one or two nuclei at 18.5 dP, 2 dL, 4 dL and 6 dL (n=3 samples per time-point). Error bars represent mean±s.e.m. **P<0.01, ***P<0.001, ****P<0.0001.
Figure 2
Figure 2. Binucleated cells are generated by failed cytokinesis and not by cell fusion.
(a) Whole-mount 3D confocal image of a ductal portion from a representative Elf5-rtTA/TetO-cre/R26R-Confetti mouse. Elf5-rtTA/TetO-cre/R26R-Confetti mice were injected with doxycycline (DOX) at 15.5 days of pregnancy and analysed at 4 dL. Fusion was evaluated by determining whether cells express more than one colour. The whole-mount was labelled for F-actin (blue). Middle and right panels show optical sections from the selected region in the left panel. No multi-coloured cells were observed, indicating that cell fusion was not involved in the formation of binucleated cells (n=4 mice). Scale bars: 200 μm (whole-mount); and 50 μm (optical sections). (b) Optical section presented with (left) and without (right) DAPI staining from large whole-mounts of mammary glands from mice chased for 6 h after EdU injection at 16.5 dP (top) or 18.5 dP (bottom). Glands were stained for DAPI (white), EdU (red), Keratin 5 (blue) and E-cadherin (green). In the top panels, EdU+ cells contain only one nucleus; white arrow depicts a cell in S/G2 phase and the yellow arrow points to two cells that appear to have just undergone division. In the bottom panels, the yellow arrow depicts a binucleated cell. (c) Optical sections from whole-mounts of mammary glands isolated from mice injected with EdU at 18.5 dP and chased for 3 days (top) or 12 days (bottom). Yellow arrows depict binucleated cells that retain EdU. The whole-mounts were labelled for DAPI (white), E-cadherin (green), EdU (red) and K5 (blue). Scale bars: 20 μm (n=3 mice for each experiment). (d) Bar graph showing the percentage of EdU+ cells for luminal cells with either one or two nuclei chased for 6 h after EdU injection at 16.5 dP or chased for 6 h, 3 days or 12 days after EdU injection at 18.5 dP (n=3 mice per time-point). Error bars represent mean±s.e.m.
Figure 3
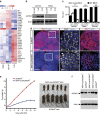
Figure 3. AURKA is induced at the onset of lactation and is essential for the formation of binucleated cells.
(a) Heat map showing genes differentially expressed between the virgin state, late pregnancy and early lactation in sorted luminal cells for the cell division GO group. AURKA and PLK1 are marked in red; P<0.05 for 2 dL versus 18.5 dP (using a TREAT-moderated t-test). (b) Representative western blot analysis (n=2) of AURKA expression in sorted luminal (LinCD29loCD24+) and basal (LinCD29hiCD24+) cells isolated from pregnant (18.5 dP) or lactating glands (1 and 2 dL). (c) Bar graph of FACS data showing percentage of cells containing 2N or 4N DNA content in the luminal, basal and stromal cell compartments from WAP-icre/AURKAf/f (AURKAΔ/Δ) and control AURKAf/f mice at 2 dL. Error bars represent mean±s.e.m. (n=3 mice) ***P<0.001. (d) Representative whole-mount 3D confocal images of ductal portions and optical sections from the enlarged region for WAP-icre/AURKAf/f glands (bottom) compared with control AURKAf/f mammary glands (top). The whole-mounts were labelled for DAPI (white), milk (red) and F-actin (blue). Scale bars: 100 μm (whole-mounts); and 20 μm (optical sections). (e) Body weight of pups nursed by WAP-icre/AURKAf/f dams versus littermate control AURKAf/f dams (n=6). Error bars represent mean±s.e.m. P<0.0001. Representative photograph of pups nursed by a WAP-icre/AURKAf/f dam versus an AURKAf/f dam at 14 dL. (f) Western blot analysis (n=2) of expression of AURKA and Actin in WAP-icre/AURKAf/f compared with AURKAf/f glands at 2 dL. The asterix denotes a nonspecific band.
Figure 4
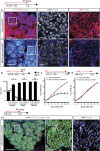
Figure 4. Temporal control of AURKA expression is important for the generation of binucleated alveolar cells.
(a) Whole-mount 3D confocal images of ductal portions and optical sections from the enlargements for Elf5-rtTA/TetO-cre/AURKAf/f gland (bottom) compared with control TetO-cre/AURKAf/f mammary gland (top). The whole-mounts were labelled for DAPI (white), GFP (green), milk (red) and F-actin (blue). The animals were given DOX food from 16.5 dP until imaging analysis at 5 dL (n=4 mice). Scale bars: 100 μm (whole-mounts); and 20 μm (optical sections). (b) Bar graph of FACS data showing percentage of cells containing 2N or 4N DNA content in the luminal, basal and stromal cell compartments from Elf5-rtTA/TetO-cre/AURKAf/f (AURKAΔ/Δ) and control AURKAf/f mice at 2 dL, after DOX induction from 16.5 dP. Error bars represent mean±s.e.m. (n=3 mice). **P<0.01. (c) Body weight of pups nursed by Elf5-rtTA/TetO-cre/AURKAf/f dams versus littermate control TetO-cre/AURKAf/f dams. DOX food was given from 16.5 dP to 14 dL (six pups per dam; n= 3 dams). P<0.0001. (d) Body weight of pups nursed by Elf5-rtTA/TetO-cre/AURKAf/f dams versus control dams. DOX was given from 4 to 14 dL (six pups per dam; n=2 dams). Error bars represent mean±s.e.m. (no significant difference). (e) Representative whole-mount 3D confocal image of a ductal portion from Elf5-rtTA/TetO-cre/AURKAf/f mice. DOX food was given to mice from 4 dL until collection at 10 dL. The whole-mount was labelled for DAPI (white), E-cadherin/GFP (green), K5 (red) and F-actin (blue) to highlight the architecture of the gland (n=2 mice). Middle and right panels show optical sections from the selected area in the left panel. Most cells remain binucleated. Scale bars: 200 μm (whole-mount); and 30 μm (optical sections).
Figure 5
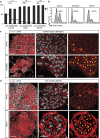
Figure 5. Pharmacological inhibition of AURKA or PLK-1 prevents the formation of binucleated cells.
(a) Bar graph showing percentage of cells containing 2N or 4N DNA content in the luminal, basal and stromal cell compartments from mice treated from 16.5 dP with vehicle, MLN8237 (AURKA inhibitor) or BI6727 (PLK-1 inhibitor) and analysed by FACS at 2 dL. Error bars represent mean±s.e.m. (n=3 mice per treatment). ***P<0.001. (b) Representative FACS plots of DNA ploidy in the luminal populations from a. (c) Representative whole-mount 3D confocal images of ductal portions and optical sections from the enlarged regions for mice treated with vehicle or MLN8237. (d) Representative whole-mount 3D confocal images of ductal portions and optical sections from the enlarged regions for mice treated with vehicle or BI6727. In c and d, the whole-mounts were labelled for DAPI (white) and F-actin (red). In the right panels, nuclei in mononucleated cells within the middle panels are depicted schematically as orange dots. Scale bars: 100 μm (whole-mounts); and 20 μm (optical sections).
Figure 6
Figure 6. Presence of binucleated luminal cells in lactating mammary tissue from different mammalian species.
(a) Whole-mount 3D confocal image of a ductal portion from paraffin-embedded (PE) mammary tissue from a late-pregnant cow (n=3). (b) Whole-mount 3D confocal image of a ductal portion from PE lactating mammary tissue from a wallaby (n=3). (c) Whole-mount 3D confocal image of a ductal portion from PE lactating mammary tissue from seal (n=3). (d) Whole-mount 3D confocal image of a ductal tree from fresh human lactating breast tissue (n=5). For each species, the depicted image is from the selected area shown in Supplementary Fig. 10a–d. The cow, seal and wallaby whole-mounts were labelled for Keratin 5 (red), β-catenin (green) and DAPI (white), whereas human tissue was stained for E-cadherin (red), F-actin (green) and DAPI (white). In the right panels, nuclei in binucleated cells within the middle panels are depicted schematically as orange dots. Scale bars: 20 μm (whole-mounts); and 10 μm (optical sections). (e) Bar graph showing per cent of binucleated and mononucleated cells in alveoli (n=3–5 samples). More than 20 alveoli (>1,000 cells) were counted for each species. Error bars represent mean±s.e.m.

Similar articles

Cited by

References

    1. Macias H. & Hinck L. Mammary gland development. Wiley Interdiscip. Rev. Dev. Biol. 1, 533–557 (2012) . - PMC - PubMed
    1. Visvader J. E. & Stingl J. Mammary stem cells and the differentiation hierarchy: current status and perspectives. Genes Dev. 28, 1143–1158 (2014) . - PMC - PubMed
    1. Hadsell D. L. et al. Changes in secretory cell turnover, and mitochondrial oxidative damage in the mouse mammary gland during a single prolonged lactation cycle suggest the possibility of accelerated cellular aging. Exp. Gerontol. 41, 271–281 (2006) . - PubMed
    1. Joshi K., Ellis J. T., Hughes C. M., Monaghan P. & Neville A. M. Cellular proliferation in the rat mammary gland during pregnancy and lactation. Lab. Invest. 54, 52–61 (1986) . - PubMed
    1. Knight C. H. & Peaker M. Mammary cell proliferation in mice during pregnancy and lactation in relation to milk yield. Q. J. Exp. Physiol. 67, 165–177 (1982) . - PubMed

Publication types

MeSH terms