. 2016 Jun;186(6):1524-36.
doi: 10.1016/j.ajpath.2016.02.006. Epub 2016 Apr 18.

Fas Regulates Macrophage Polarization and Fibrogenic Phenotype in a Model of Chronic Ethanol-Induced Hepatocellular Injury

Affiliations

Fas Regulates Macrophage Polarization and Fibrogenic Phenotype in a Model of Chronic Ethanol-Induced Hepatocellular Injury

Fuyumi Isayama et al. Am J Pathol. 2016 Jun.

Abstract

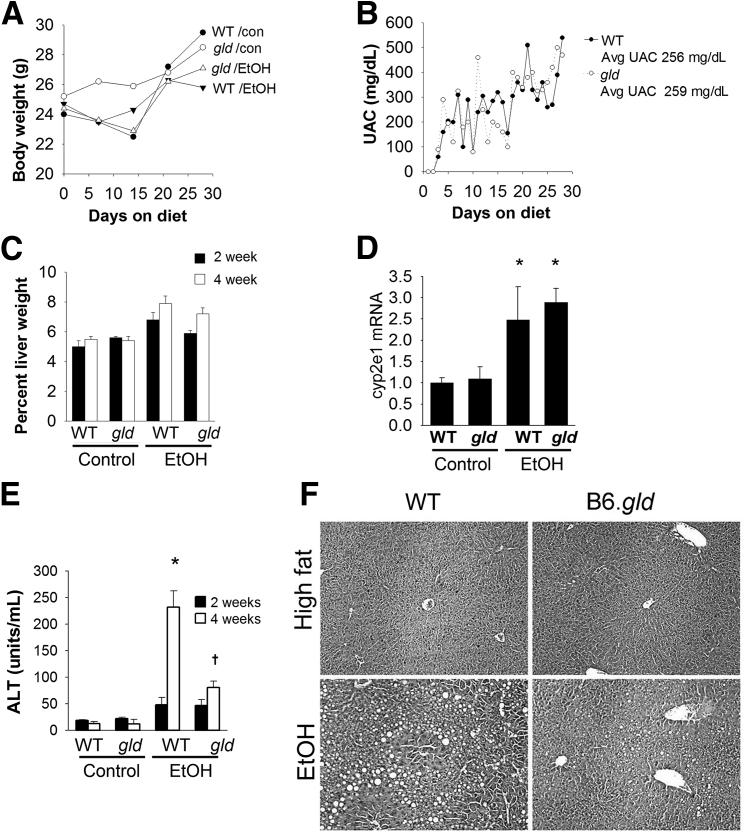
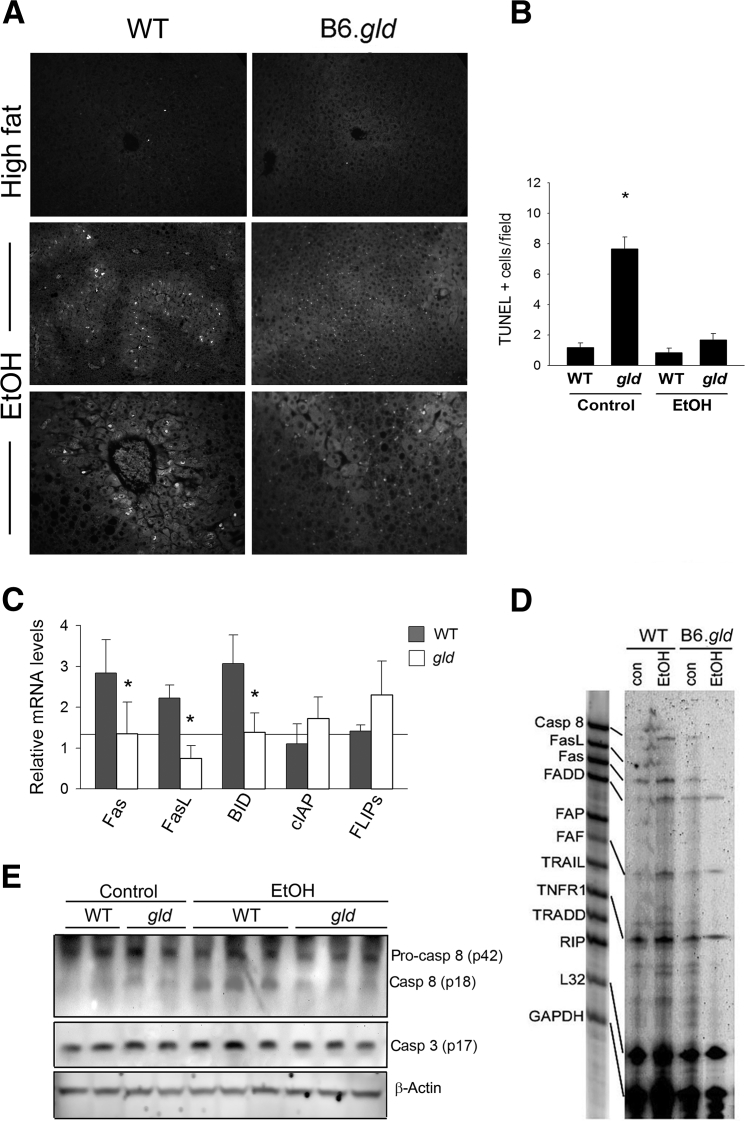
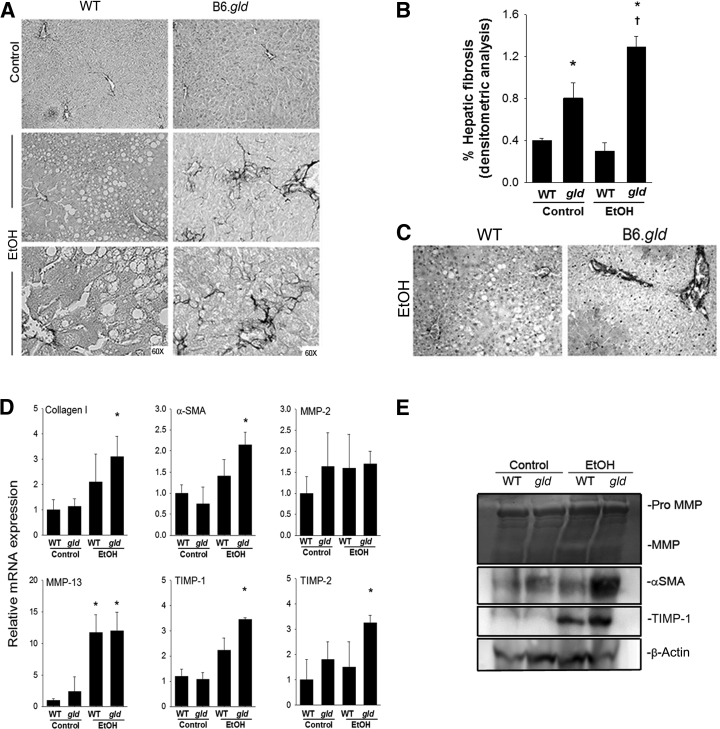
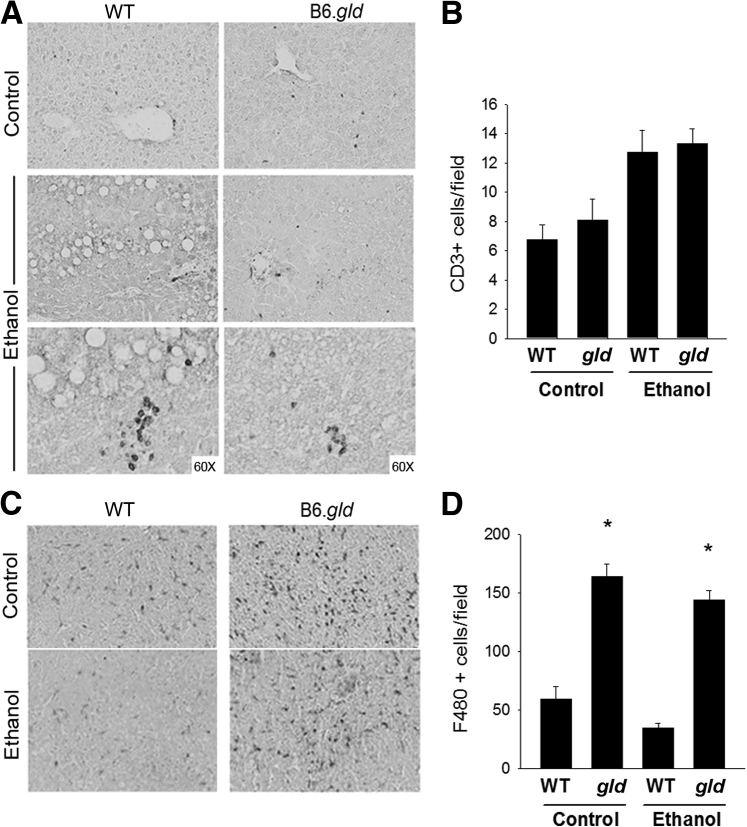
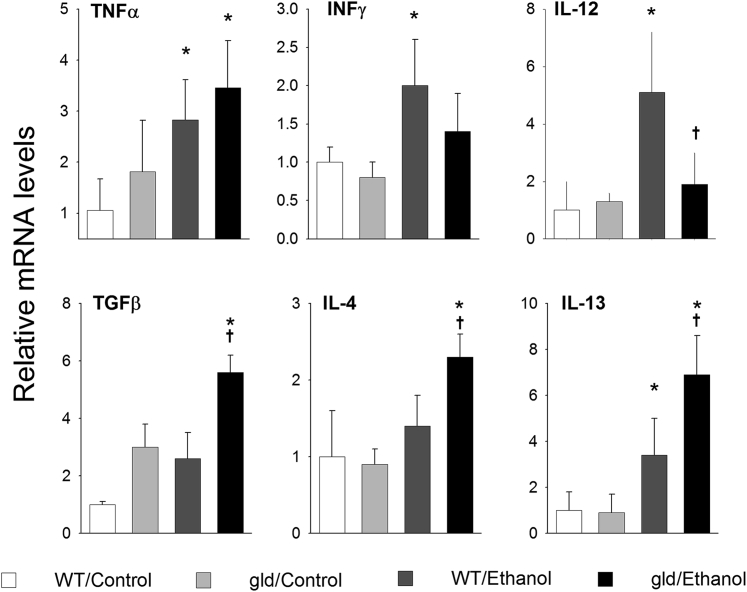
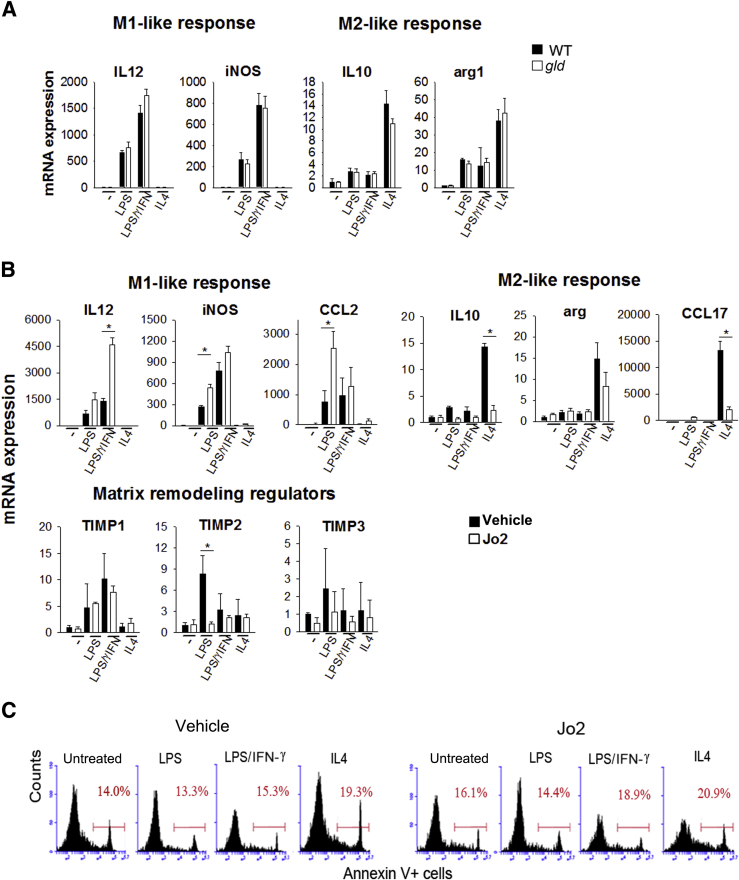
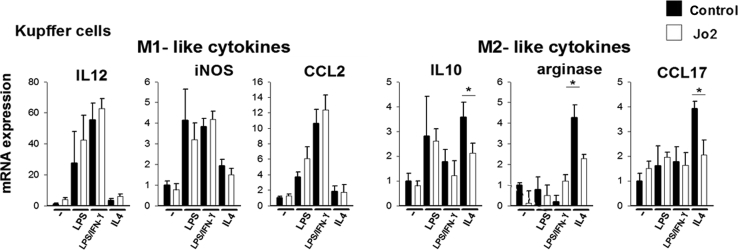
The role of Fas-mediated apoptosis and its effect on proinflammatory cytokine production in early alcoholic liver disease has not been addressed. Wild-type mice (C57Bl/6) or mice with a functional mutation in the Fas ligand (B6.gld) were given either high-fat control diet or ethanol diet by intragastric cannulation for 2 or 4 weeks. Liver injury, hepatic lipid accumulation, and proinflammatory cytokine production associated with chronic ethanol consumption were largely prevented in B6.gld mice compared with wild-type mice. Conversely, B6.gld mice given ethanol exhibited increases in collagen deposition, hepatic collagen gene expression, and profibrogenic cytokines (eg, transforming growth factor-β and IL-13) and alterations in matrix remodeling proteins (eg, matrix metalloproteinases and tissue inhibitor of metalloproteinases) compared with wild-type mice. Hepatic F4/80(+) macrophage populations were increased significantly in B6.gld mice compared with wild-type mice; hepatic CD3(+) cell populations were not significantly different. Importantly, a shift toward the expression of M2/Th2 cytokines (eg, IL-4 and IL-13) after ethanol exposure was observed in B6.gld mice compared with classical M1 cytokine expression in wild-type mice under similar conditions. In isolated macrophages, stimulation of Fas receptor minimally enhances lipopolysaccharide-induced M1 cytokine production and significantly limits M2 cytokine production. These data support the hypothesis that Fas-mediated signaling is important for an early ethanol-induced proinflammatory response but limits the profibrogenic response, regulating collagen production in response to chronic ethanol.


Figures

Figure 1
Figure 1
Routine variables associated with chronic EtOH-induced liver injury. WT and B6.gld mutant mice were fed either the control diet or diet that contained EtOH intragastrically for 2 or 4 weeks. A: Initial and weekly body weights. B: Urine was collected daily, and UAC was determined as described in Materials and Methods. The average UAC was also determined. C: Percentage of liver weight relative to total body weight was determined after sacrifice at either 2 or 4 weeks. D: The expression of cyp2e1 was assessed by real-time quantitative PCR from whole liver mRNA isolated from WT and B6.gld mice fed either the control diet or EtOH diet with the use of the primer sets described in Table 1. E: Serum ALT was determined in WT and B6.gld mutant mice after 2 and 4 weeks of either the control or EtOH-containing diet. F: Livers were harvested, formalin-fixed, and paraffin-embedded. Sections (6 μm) were stained with hematoxylin and eosin as described in Materials and Methods. Data are expressed as means ± SEM. n = 3 to 4 mice per group. P < 0.05 versus mice fed the control diet; P < 0.05 versus WT mice after EtOH administration. Original magnification, ×20. ALT, alanine transaminase; Avg, average; Con, control; EtOH, ethanol; UAC, urine alcohol concentration; WT, wild-type.
Figure 2
Figure 2
Hepatocellular apoptosis. WT and B6.gld mutant mice were fed either the control diet or diet that contained EtOH intragastrically for 4 weeks. A: Liver sections (6 μm) were labeled with the use of in situ cell death detection assay (ie, TUNEL) as described in Materials and Methods. B: Image densitometry for TUNEL immunohistochemical staining from replicates for this measurement and each tissue section was pooled to determine means. C: Liver mRNA was isolated from WT and B6.gld mutant mice that were fed either the control diet or diet that contained EtOH intragastrically for 4 weeks. RNase protection assays were performed as described in Materials and Methods with the use of the APO-1 multiprobe template (BD PharMingen) to evaluate the expression of Fas-related genes. D: Quantitative PCR was used to measure the expression of apoptosis-related genes with the use of whole liver mRNA, using the primer sets described in Table 1. E: Whole-liver lysates were used to assess caspase expression/activity by Western blot analysis with the use of antibodies against full-length and cleaved isoforms of caspase 8 and caspase 3. Expression of β-actin as a loading control was determined by antibodies against mouse β-actin (dilution 1:1000; Sigma-Aldrich). Data are expressed as means ± SEM relative increase over Con-treated mice. n = 3 to 4 mice per group (A and E); n = 3 to 4 replicates (B); n = 5 fields per tissue section (B); n = 3 to 4 samples per group (C); n = 3 experiments per group (E). P < 0.05 versus WT mice after EtOH administration. Original magnification, ×20. Con, control; EtOH, ethanol; FasL, Fas ligand; TUNEL, terminal deoxynucleotidyl transferase-mediated dUTP nick-end labeling; WT, wild-type.
Figure 3
Figure 3
Histologic analysis of fibrosis and expression of α-SMA, collagen, and collagen-related genes. A: WT and B6.gld mutant mice were given the control diet or EtOH diet intragastrically for 4 weeks. Liver sections were collected and stained with the use of Sirius Red as described in Materials and Methods. Representative photomicrographs of Sirius Red staining and higher magnification of EtOH-treated mice. B: Image densitometry for Sirius Red staining from replicates for this measurement and each tissue section were pooled to determine means. C: Liver sections were collected and stained with antibodies against α-SMA (dilution 1:200; Dako Invision Inc.) as described in Materials and Methods. D: Liver mRNA was isolated from WT and B6.gld mutant mice that were fed either the control diet or diet that contained EtOH intragastrically for 4 weeks. Real-time quantitative PCR was performed for collagen I, α-SMA, MMP-2, MMP-13, TIMP-1, and TIMP-2 as described in Materials and Methods with the use of the primer sets described in Table 1. E: Whole-liver lysates were used to assess MMP activity with the use of gelatin zymography (top panel) and expression α-SMA, TIMP-1, and β-actin with the use of Western blot analysis. Expression of β-actin was used as a control. Data are expressed as means ± SEM. n = 4 replicates (B); n = 10 fields per section (B); n = 3 experiments in each group (E). P < 0.05 versus mice fed the control diet; P < 0.05 versus wild-type mice after EtOH administration. Original magnification: ×20 (A, top); ×60 (Abottom). EtOH, ethanol; MMP, matrix metalloproteinases; TIMP, tissue inhibitor of metalloproteinases; WT, wild-type; α-SMA, α-smooth muscle actin.
Figure 4
Figure 4
Immunohistochemistry of liver CD3+ and F4/80+ cell infiltration. A: WT and B6.gld mutant mice were given the control diet or ethanol diet intragastrically for 4 weeks. Liver sections were collected and stained with antibodies against T lymphocyte marker CD3 (dilution 1:100; Santa Cruz Biotechnology) as described in Materials and Methods. Representative photomicrographs of CD3 immunohistochemical staining and higher magnification of ethanol-treated mice. B: Image densitometry for CD3 immunohistochemical staining from replicates for this measurement and each tissue section were pooled to determine means. C: Liver sections were collected and stained with antibodies against macrophage marker F4/80 (dilution 1:100; eBiosource) as described in Materials and Methods. Representative photomicrographs of F4/80 immunohistochemical staining. D: Image densitometry for F4/80 immunohistochemical staining from replicates for this measurement and each tissue section were pooled to determine means. Data are expressed as means ± SEM. n = 3 to 4 replicates (B); n = 10 fields per section (B and D); n = 4 replicates (D). P < 0.05 versus mice fed the control diet. Original magnification: ×20 (Atop, and C); ×60 (A, bottom). WT, wild-type.
Figure 5
Figure 5
Expression of cytokines in liver. Liver mRNA was isolated from WT and B6.gld mutant mice that were fed either the control diet or diet that contained ethanol intragastrically for 4 weeks. Real-time quantitative PCR was performed for TNF-α, TGF-β, IFN-γ, IL-12, IL-4, and IL-13 as described in Materials and Methods with the use of the primers described in Table 1. Data are expressed as means ± SEM. P < 0.05 versus mice fed the control diet; P < 0.05 versus WT mice after ethanol administration. IFN, interferon; TGF, transforming growth factor; TNF, tumor necrosis factor; WT, wild-type.
Figure 6
Figure 6
Polarization of BMDMs in vitro. Naive BMDMs from WT mice were obtained as described in Materials and Methods. A: BMDMs from WT and B6.gld mice were stimulated with 100 ng/mL LPS, LPS combined with 20 ng/mL IFN-γ, or 2 ng/mL IL-4 for 4 hours. mRNA levels of cytokines IL-12 and IL-10, iNOS, and arginase were measured by qPCR. B: BMDMs were stimulated as above for 4 hours in the presence of 0.1 μg/mL Jo2 antibody (BD PharMingen) or saline as vehicle. mRNA was isolated, and the relative gene expression of a panel of M1-like and M2-like cytokines, chemokines, and regulatory factors and matrix-related TIMP expression was analyzed by qPCR. C: BMDMs were stimulated as above for 24 hours in the presence of 0.1 μg/mL Jo2 antibody (BD PharMingen) or saline as vehicle. Cell survival was assessed by Annexin V/PI labeling by flow cytometry. Representative histograms and percentages of Annexin V/PI+ cells are shown. Data are expressed as means ± SEM. n = 3 separate experiments. P < 0.05 versus vehicle-treated cells. BMDM, bone-marrow-derived macrophage; CCL, chemokine ligand; IFN, interferon; iNOS, inducible nitric oxide synthase; LPS, lipopolysaccharide; PI, propidium iodide; qPCR, real-time quantitative PCR; TIMP, tissue inhibitors of MMP; WT, wild type.
Figure 7
Figure 7
Polarization of primary Kupffer cells in the presence of Fas ligand. Primary Kupffer cells isolated from untreated C57Bl/6J mice were obtained as described in Materials and Methods. Kupffer cells were stimulated with 100 ng/mL LPS, LPS combined with 20 ng/mL IFN-γ, or 2 ng/mL IL-4 for 4 hours in the presence of 0.1 μg/mL Jo2 antibody (BD PharMingen) or saline as vehicle. mRNA was isolated, and the relative gene expression of a panel of cytokines, chemokines, and regulatory factors was analyzed by real-time quantitative PCR. Data are expressed as means ± SEM. n = 3 separate experiments. P < 0.05 versus vehicle-treated cells. CCL, chemokine ligand; IFN, interferon; iNOS, inducible nitric oxide synthase; LPS, lipopolysaccharide.

Similar articles

Cited by

References

    1. Bataller R., Brenner D.A. Liver fibrosis. J Clin Invest. 2005;115:209–218. - PMC - PubMed
    1. Higuchi H., Gores G.J. Mechanisms of liver injury: an overview. Curr Mol Med. 2003;3:483–490. - PubMed
    1. Friedman S.L., Roll F.J., Boyles J., Bissell D.M. Hepatic lipocytes: the principal collagen-producing cells of normal rat liver. Proc Natl Acad Sci U S A. 1985;82:8681–8685. - PMC - PubMed
    1. Arthur M.J., Friedman S.L., Roll F.J., Bissell D.M. Lipocytes from normal rat liver release a neutral metalloproteinase that degrades basement membrane (type IV) collagen. J Clin Invest. 1989;84:1076–1085. - PMC - PubMed
    1. Canbay A., Higuchi H., Bronk S.F., Taniai M., Sebo T.J., Gores G.J. Fas enhances fibrogenesis in the bile duct ligated mouse: a link between apoptosis and fibrosis. Gastroenterology. 2002;123:1323–1330. - PubMed

Publication types

MeSH terms