

Differential diagnosis of neurodegenerative diseases using structural MRI data
- PMID: 27104138
- PMCID: PMC4827727
- DOI: 10.1016/j.nicl.2016.02.019
Differential diagnosis of neurodegenerative diseases using structural MRI data
Abstract
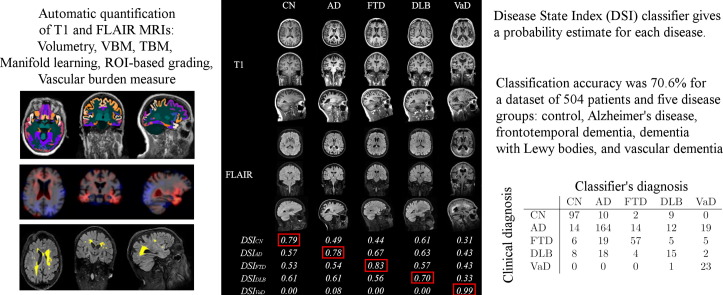
Different neurodegenerative diseases can cause memory disorders and other cognitive impairments. The early detection and the stratification of patients according to the underlying disease are essential for an efficient approach to this healthcare challenge. This emphasizes the importance of differential diagnostics. Most studies compare patients and controls, or Alzheimer's disease with one other type of dementia. Such a bilateral comparison does not resemble clinical practice, where a clinician is faced with a number of different possible types of dementia. Here we studied which features in structural magnetic resonance imaging (MRI) scans could best distinguish four types of dementia, Alzheimer's disease, frontotemporal dementia, vascular dementia, and dementia with Lewy bodies, and control subjects. We extracted an extensive set of features quantifying volumetric and morphometric characteristics from T1 images, and vascular characteristics from FLAIR images. Classification was performed using a multi-class classifier based on Disease State Index methodology. The classifier provided continuous probability indices for each disease to support clinical decision making. A dataset of 504 individuals was used for evaluation. The cross-validated classification accuracy was 70.6% and balanced accuracy was 69.1% for the five disease groups using only automatically determined MRI features. Vascular dementia patients could be detected with high sensitivity (96%) using features from FLAIR images. Controls (sensitivity 82%) and Alzheimer's disease patients (sensitivity 74%) could be accurately classified using T1-based features, whereas the most difficult group was the dementia with Lewy bodies (sensitivity 32%). These results were notable better than the classification accuracies obtained with visual MRI ratings (accuracy 44.6%, balanced accuracy 51.6%). Different quantification methods provided complementary information, and consequently, the best results were obtained by utilizing several quantification methods. The results prove that automatic quantification methods and computerized decision support methods are feasible for clinical practice and provide comprehensive information that may help clinicians in the diagnosis making.
Keywords: Alzheimer's disease; Classification; Dementia with Lewy bodies; Frontotemporal lobar degeneration; MRI; Neurodegenerative diseases; TBM; VBM; Vascular dementia; Volumetry.
Figures


References
-
- Aljabar P., Heckemann R., Hammers A., Hajnal J., Rueckert D. Multi-atlas based segmentation of brain images: atlas selection and its effect on accuracy. NeuroImage. 2009;46(3):726–738. - PubMed
-
- Artaechevarria X., Munoz-Barrutia A., de Solorzano C.O. Combination strategies in multi-atlas image segmentation: application to brain MR data. IEEE Trans. Med. Imaging. 2009;28(8):1266–1277. - PubMed
-
- Ashburner J., Friston K. Voxel-based morphometry — the methods. NeuroImage. 2000;11(6):805–821. - PubMed
-
- Ballmaier M., O'Brien J.T., Burton E.J., Thompson P.M., Rex D.E., Narr K.L., McKeith I.G., DeLuca H., Toga A.W. Comparing gray matter loss profiles between dementia with Lewy bodies and Alzheimer's disease using cortical pattern matching: diagnosis and gender effects. NeuroImage. 2004;23(1):325–335. - PubMed
Publication types
MeSH terms
LinkOut - more resources
Full Text Sources
Other Literature Sources
Medical
