

Linking white matter and deep gray matter alterations in premanifest Huntington disease
- PMID: 27104139
- PMCID: PMC4827723
- DOI: 10.1016/j.nicl.2016.02.014
Linking white matter and deep gray matter alterations in premanifest Huntington disease
Abstract
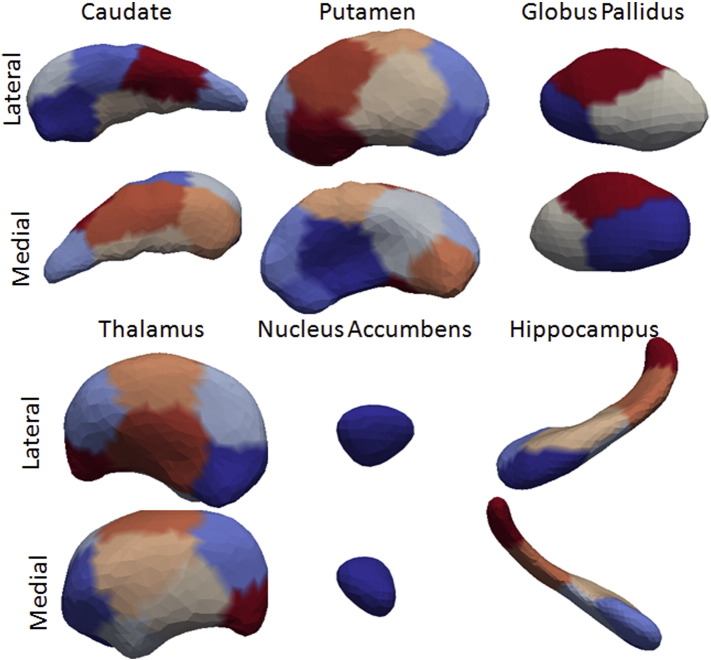
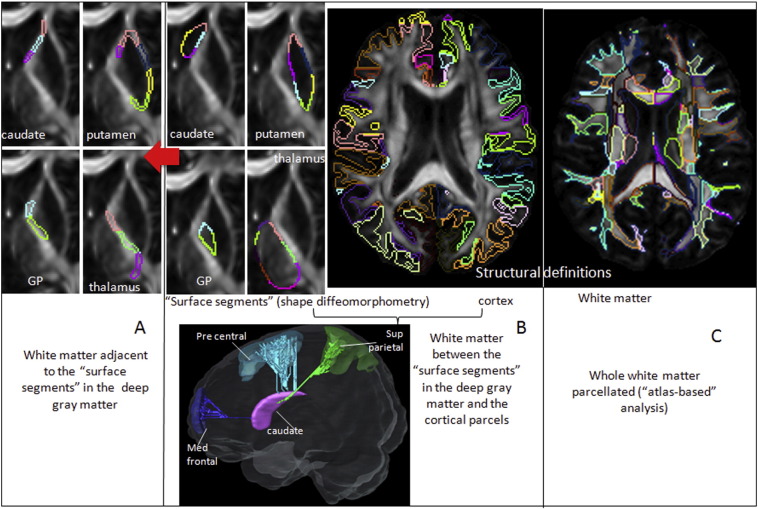
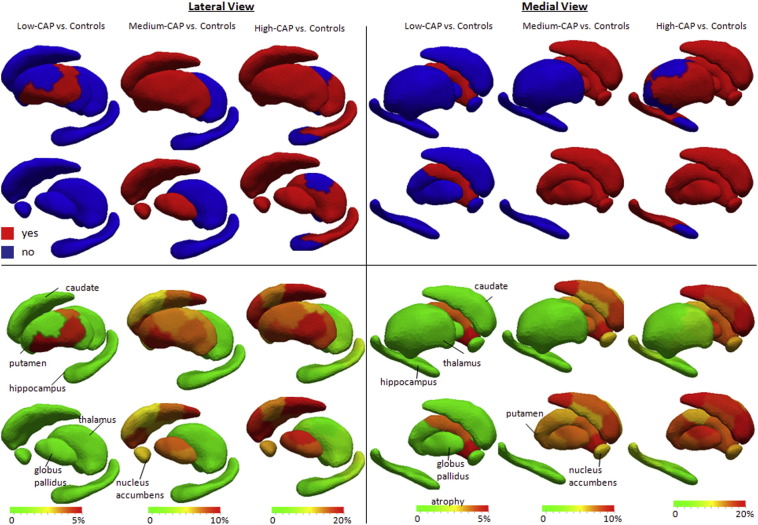
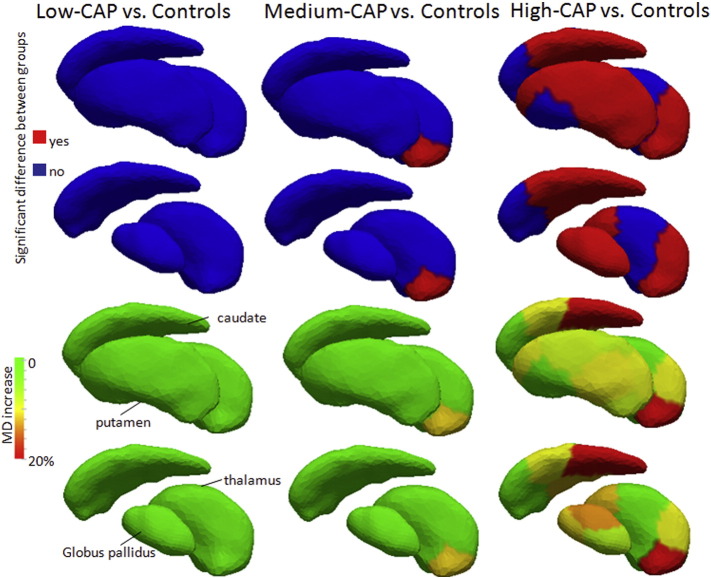
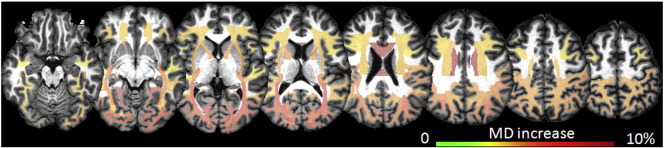
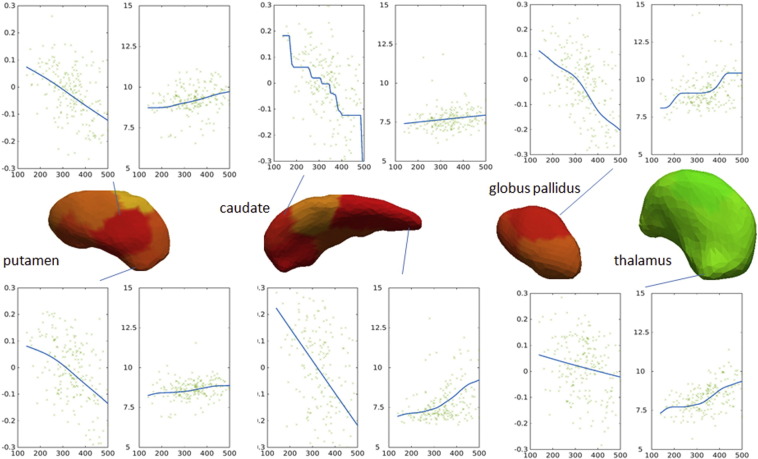
Huntington disease (HD) is a fatal progressive neurodegenerative disorder for which only symptomatic treatment is available. A better understanding of the pathology, and identification of biomarkers will facilitate the development of disease-modifying treatments. HD is potentially a good model of a neurodegenerative disease for development of biomarkers because it is an autosomal-dominant disease with complete penetrance, caused by a single gene mutation, in which the neurodegenerative process can be assessed many years before onset of signs and symptoms of manifest disease. Previous MRI studies have detected abnormalities in gray and white matter starting in premanifest stages. However, the understanding of how these abnormalities are related, both in time and space, is still incomplete. In this study, we combined deep gray matter shape diffeomorphometry and white matter DTI analysis in order to provide a better mapping of pathology in the deep gray matter and subcortical white matter in premanifest HD. We used 296 MRI scans from the PREDICT-HD database. Atrophy in the deep gray matter, thalamus, hippocampus, and nucleus accumbens was analyzed by surface based morphometry, and while white matter abnormalities were analyzed in (i) regions of interest surrounding these structures, using (ii) tractography-based analysis, and using (iii) whole brain atlas-based analysis. We detected atrophy in the deep gray matter, particularly in putamen, from early premanifest stages. The atrophy was greater both in extent and effect size in cases with longer exposure to the effects of the CAG expansion mutation (as assessed by greater CAP-scores), and preceded detectible abnormalities in the white matter. Near the predicted onset of manifest HD, the MD increase was widespread, with highest indices in the deep and posterior white matter. This type of in-vivo macroscopic mapping of HD brain abnormalities can potentially indicate when and where therapeutics could be targeted to delay the onset or slow the disease progression.
Keywords: Atrophy; DTI; Diffeomorphometry; Huntington; MRI; Shape.
Figures
References
-
- Ashburner J., Csernansky J.G., Davatzikos C., Fox N.C., Frisoni G.B., Thompson P.M. Computer-assisted imaging to assess brain structure in healthy and diseased brains. Lancet Neurol. 2003;2(2):79–88. - PubMed
-
- Aylward E.H., Codori A.M., Rosenblatt A., Sherr M., Brandt J., Stine O.C., Barta P.E., Pearlson G.D., Ross C.A. Rate of caudate atrophy in presymptomatic and symptomatic stages of Huntington's disease. Mov. Disord. 2000;15(3):552–560. - PubMed
-
- Aylward E.H., Li Q., Stine O.C., Ranen N., Sherr M., Barta P.E., Bylsma F.W., Pearlson G.D., Ross C.A. Longitudinal change in basal ganglia volume in patients with Huntington's disease. Neurology. 1997;48(2):394–399. - PubMed
Publication types
MeSH terms
Grants and funding
- R01 NS103475/NS/NINDS NIH HHS/United States
- NS40068/NS/NINDS NIH HHS/United States
- R01-EB008171/EB/NIBIB NIH HHS/United States
- R01 EB008171/EB/NIBIB NIH HHS/United States
- R01 NS084957/NS/NINDS NIH HHS/United States
- U01 NS105509/NS/NINDS NIH HHS/United States
- R01 EB000975/EB/NIBIB NIH HHS/United States
- R01-EB000975/EB/NIBIB NIH HHS/United States
- P01 NS016375/NS/NINDS NIH HHS/United States
- R03-EB014357/EB/NIBIB NIH HHS/United States
- R01 NS040068/NS/NINDS NIH HHS/United States
- R03 EB014357/EB/NIBIB NIH HHS/United States
- U01-NS082085/NS/NINDS NIH HHS/United States
- U01 NS082085/NS/NINDS NIH HHS/United States
- P41 EB015909/EB/NIBIB NIH HHS/United States
- P50NS16375/NS/NINDS NIH HHS/United States
- P41-EB015909/EB/NIBIB NIH HHS/United States
LinkOut - more resources
Full Text Sources
Other Literature Sources
Medical
Miscellaneous
