

Quantifiable Imaging Biomarkers for Evaluation of the Posterior Cruciate Ligament Using 3-T Magnetic Resonance Imaging: A Feasibility Study
- PMID: 27104206
- PMCID: PMC4827116
- DOI: 10.1177/2325967116639044
Quantifiable Imaging Biomarkers for Evaluation of the Posterior Cruciate Ligament Using 3-T Magnetic Resonance Imaging: A Feasibility Study
Abstract
Background: Quantitative magnetic resonance imaging (MRI) techniques, such as T2 and T2 star (T2*) mapping, have been used to evaluate ligamentous tissue in vitro and to identify significant changes in structural integrity of a healing ligament. These studies lay the foundation for a clinical study that uses quantitative mapping to evaluate ligaments in vivo, particularly the posterior cruciate ligament (PCL). To establish quantitative mapping as a clinical tool for identifying and evaluating chronic or acute PCL injuries, T2 and T2* values first must be determined for an asymptomatic population.
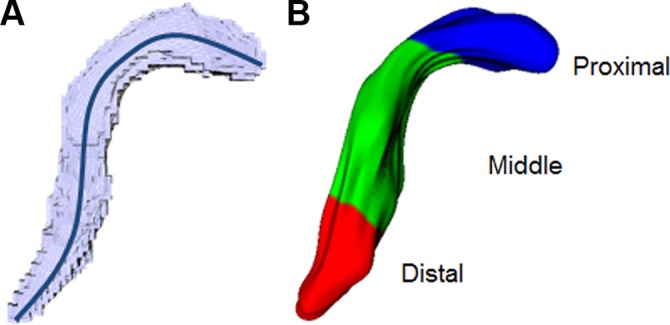
Purpose: To quantify T2 and T2* mapping properties, including texture variables (entropy, variance, contrast, homogeneity), of the PCL in an asymptomatic population. It was hypothesized that biomarker values would be consistent throughout the ligament, as measured across 3 clinically relevant subregions (proximal, middle, and distal thirds) in the asymptomatic cohort.
Study design: Cross-sectional study; Level of evidence, 4.
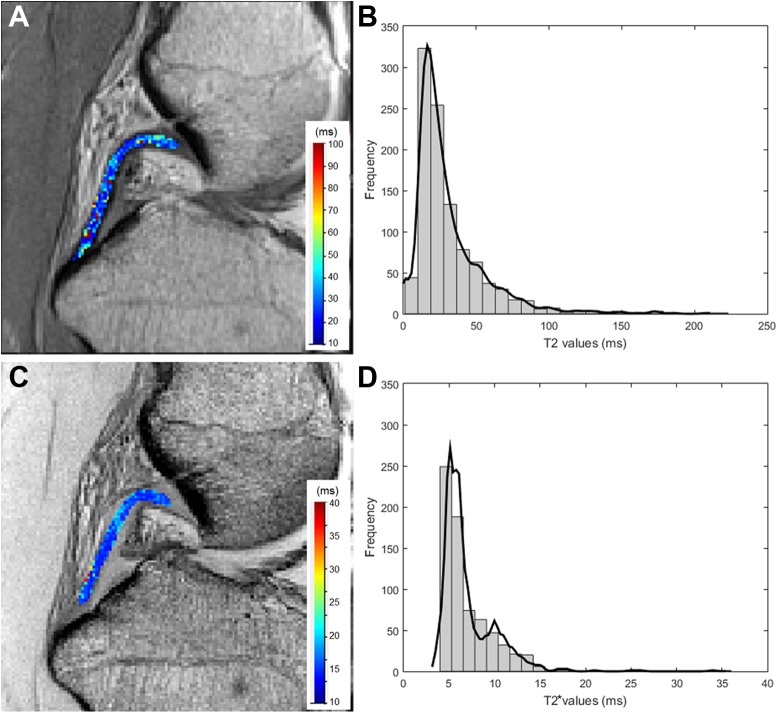
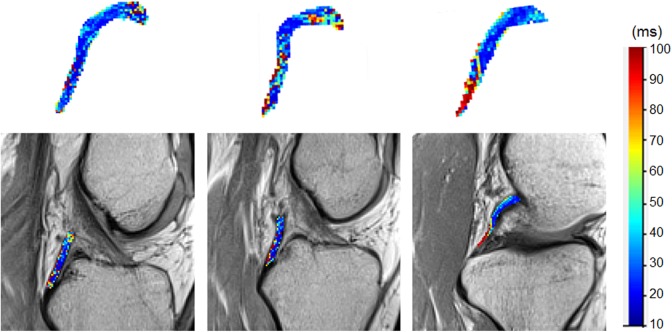
Methods: Unilateral knee MRI scans were acquired for 25 asymptomatic subjects with a 3.0-T MRI system using T2 and T2* mapping sequences in the sagittal plane. The PCL was manually segmented and divided into thirds (proximal, middle, and distal). Summary statistics for T2 and T2* values were calculated. Intra- and interrater reliability was assessed across 3 raters to 2 time points.
Results: The asymptomatic PCL cohort had mean T2 values of 36.7, 29.2, and 29.6 ms in the distal, middle, and proximal regions, respectively. The distal PCL exhibited significantly higher mean, variance, and contrast and lower homogeneity of T2 values than the middle and proximal subregions (P < .05). T2* results exhibited substantial positive skew and were therefore presented as median and quartile (Q) values. Median T2* values were 7.3 ms (Q1-Q3, 6.8-8.9 ms), 7.3 ms (Q1-Q3, 7.0-8.5 ms), and 7.3 ms (Q1-Q3, 6.4-8.2 ms) in the distal, middle, and proximal subregions, respectively.
Conclusion: This is the first study to identify T2 and T2* mapping values, and their texture variables, for the asymptomatic PCL. The distal third of the PCL had significantly greater T2 values than the proximal or middle thirds.
Clinical relevance: T2 and T2* values of the asymptomatic PCL can provide a baseline for comparison with acute and chronic PCL injuries in future studies.
Keywords: MRI; T2 mapping; T2* mapping; asymptomatic; posterior cruciate ligament.
Conflict of interest statement
One or more of the authors has declared the following potential conflict of interest: R.F.L. is a consultant for and receives royalties from Arthex, Ossur, and Smith & Nephew.
Figures
Similar articles
-
Quantitative mapping of acute and chronic PCL pathology with 3 T MRI: a prospectively enrolled patient cohort.J Exp Orthop. 2019 May 28;6(1):22. doi: 10.1186/s40634-019-0188-2. J Exp Orthop. 2019. PMID: 31139976 Free PMC article.
-
Quantitative analysis of the ACL and PCL using T1rho and T2 relaxation time mapping: an exploratory, cross-sectional comparison between OA and healthy control knees.BMC Musculoskelet Disord. 2021 Oct 30;22(1):916. doi: 10.1186/s12891-021-04755-y. BMC Musculoskelet Disord. 2021. PMID: 34717593 Free PMC article.
-
UTE-T2* versus conventional T2* mapping to assess posterior cruciate ligament ultrastructure and integrity-an in-situ study.Quant Imaging Med Surg. 2022 Aug;12(8):4190-4201. doi: 10.21037/qims-22-251. Quant Imaging Med Surg. 2022. PMID: 35919061 Free PMC article.
-
The Value of Accurate Magnetic Resonance Characterization of Posterior Cruciate Ligament Tears in the Setting of Multiligament Knee Injury: Imaging Features Predictive of Early Repair vs Reconstruction.Curr Probl Diagn Radiol. 2016 Jan-Feb;45(1):10-6. doi: 10.1067/j.cpradiol.2015.06.005. Epub 2015 Jun 18. Curr Probl Diagn Radiol. 2016. PMID: 26183069 Review.
-
Injuries to the posterior cruciate ligament of the knee.Sports Med. 1991 Aug;12(2):110-31. doi: 10.2165/00007256-199112020-00004. Sports Med. 1991. PMID: 1947532 Review.
Cited by
-
Quantitative mapping of acute and chronic PCL pathology with 3 T MRI: a prospectively enrolled patient cohort.J Exp Orthop. 2019 May 28;6(1):22. doi: 10.1186/s40634-019-0188-2. J Exp Orthop. 2019. PMID: 31139976 Free PMC article.
-
Quantitative analysis of the ACL and PCL using T1rho and T2 relaxation time mapping: an exploratory, cross-sectional comparison between OA and healthy control knees.BMC Musculoskelet Disord. 2021 Oct 30;22(1):916. doi: 10.1186/s12891-021-04755-y. BMC Musculoskelet Disord. 2021. PMID: 34717593 Free PMC article.
-
Evaluation of the degenerative pattern of PCL in osteoarthritis patients using UTE-T2 mapping.Asia Pac J Sports Med Arthrosc Rehabil Technol. 2021 Feb 17;24:35-40. doi: 10.1016/j.asmart.2021.01.004. eCollection 2021 Apr. Asia Pac J Sports Med Arthrosc Rehabil Technol. 2021. PMID: 33680861 Free PMC article.
-
Micro- and Macroscale Assessment of Posterior Cruciate Ligament Functionality Based on Advanced MRI Techniques.Diagnostics (Basel). 2021 Sep 28;11(10):1790. doi: 10.3390/diagnostics11101790. Diagnostics (Basel). 2021. PMID: 34679487 Free PMC article.
-
Longitudinal T2 Mapping and Texture Feature Analysis in the Detection and Monitoring of Experimental Post-Traumatic Cartilage Degeneration.Life (Basel). 2021 Mar 5;11(3):201. doi: 10.3390/life11030201. Life (Basel). 2021. PMID: 33807740 Free PMC article.
References
-
- Biercevicz AM, Miranda DL, Machan JT, Murray MM, Fleming BC. In situ, noninvasive, T2*-weighted MRI-derived parameters predict ex vivo structural properties of an anterior cruciate ligament reconstruction or bioenhanced primary repair in a porcine model. Am J Sports Med. 2013;41:560–566. - PMC - PubMed
LinkOut - more resources
Full Text Sources
Other Literature Sources
