

Medical Team Evaluation: Effect on Emergency Department Waiting Time and Length of Stay
- PMID: 27104911
- PMCID: PMC4841508
- DOI: 10.1371/journal.pone.0154372
Medical Team Evaluation: Effect on Emergency Department Waiting Time and Length of Stay
Abstract
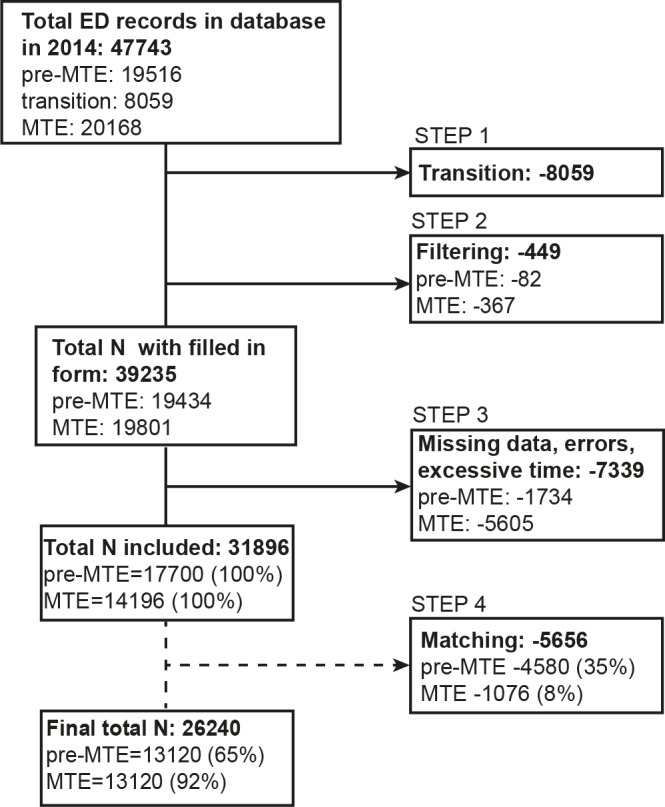
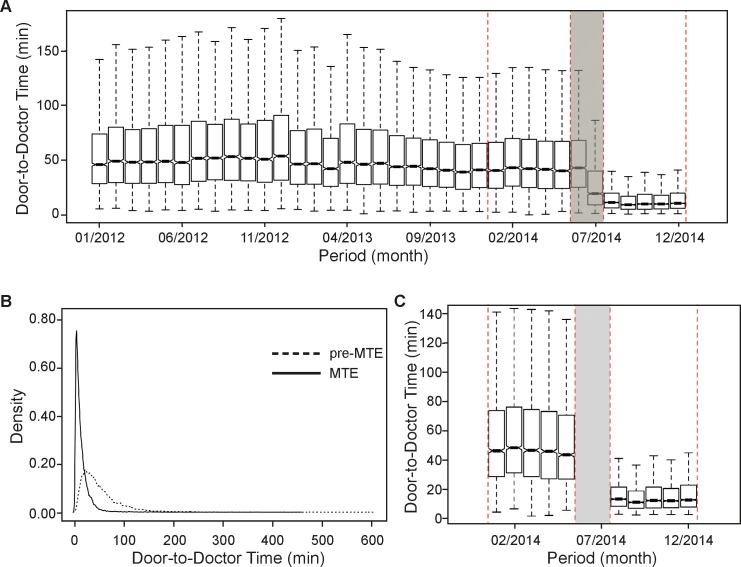
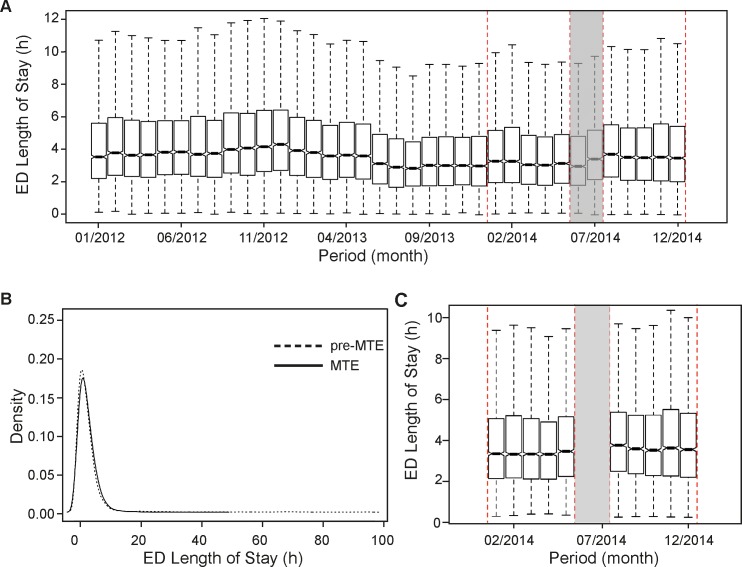
Emergency Departments (ED) are trying to alleviate crowding using various interventions. We assessed the effect of an alternative model of care, the Medical Team Evaluation (MTE) concept, encompassing team triage, quick registration, redesign of triage rooms and electronic medical records (EMR) on door-to-doctor (waiting) time and ED length of stay (LOS). We conducted an observational, before-and-after study at an urban academic tertiary care centre. On July 17th 2014, MTE was initiated from 9:00 a.m. to 10 p.m., 7 days a week. A registered triage nurse was teamed with an additional senior ED physician. Data of the 5-month pre-MTE and the 5-month MTE period were analysed. A matched comparison of waiting times and ED LOS of discharged and admitted patients pertaining to various Emergency Severity Index (ESI) triage categories was performed based on propensity scores. With MTE, the median waiting times improved from 41.2 (24.8-66.6) to 10.2 (5.7-18.1) minutes (min; P < 0.01). Though being beneficial for all strata, the improvement was somewhat greater for discharged, than for admitted patients. With a reduction from 54.3 (34.2-84.7) to 10.5 (5.9-18.4) min (P < 0.01), in terms of waiting times, MTE was most advantageous for ESI4 patients. The overall median ED LOS increased for about 15 min (P < 0.01), increasing from 3.4 (2.1-5.3) to 3.7 (2.3-5.6) hours. A significant increase was observed for all the strata, except for ESI5 patients. Their median ED LOS dropped by 73% from 1.2 (0.8-1.8) to 0.3 (0.2-0.5) hours (P < 0.01). In the same period the total orders for diagnostic radiology increased by 1,178 (11%) from 10,924 to 12,102 orders, with more imaging tests being ordered for ESI 2, 3 and 4 patients. Despite improved waiting times a decrease of ED LOS was only seen in ESI level 5 patients, whereas in all the other strata ED LOS increased. We speculate that this was brought about by the tendency of triage physicians to order more diagnostic radiology, anticipating that it may be better for the downstream physician to have more information rather than less.
Conflict of interest statement
Figures
References
-
- Pines JM, Hilton JA, Weber EJ, Alkemade AJ, Al Shabanah H, Anderson PD, et al. International perspectives on emergency department crowding. Academic emergency medicine: official journal of the Society for Academic Emergency Medicine. 2011;18(12):1358–70. Epub 2011/12/16. 10.1111/j.1553-2712.2011.01235.x . - DOI - PubMed
-
- Hwang U, McCarthy ML, Aronsky D, Asplin B, Crane PW, Craven CK, et al. Measures of crowding in the emergency department: a systematic review. Academic emergency medicine: official journal of the Society for Academic Emergency Medicine. 2011;18(5):527–38. Epub 2011/05/17. 10.1111/j.1553-2712.2011.01054.x . - DOI - PubMed
Publication types
MeSH terms
LinkOut - more resources
Full Text Sources
Other Literature Sources
Medical
