. 2016 Apr 22;11(4):e0154194.
doi: 10.1371/journal.pone.0154194. eCollection 2016.

Functional Implications of Human-Specific Changes in Great Ape microRNAs

Affiliations

Functional Implications of Human-Specific Changes in Great Ape microRNAs

Alicia Gallego et al. PLoS One. .

Abstract

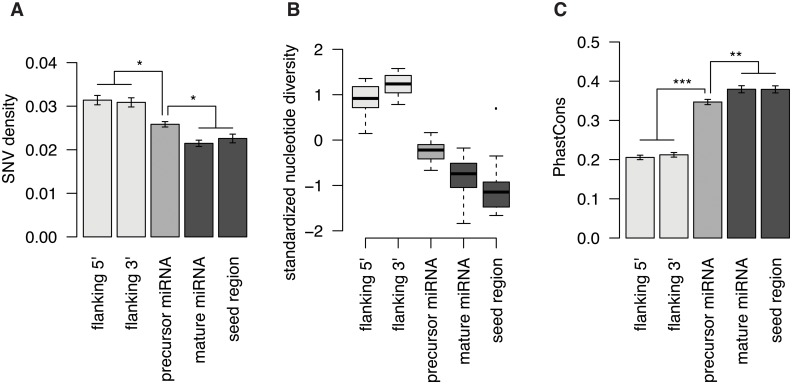
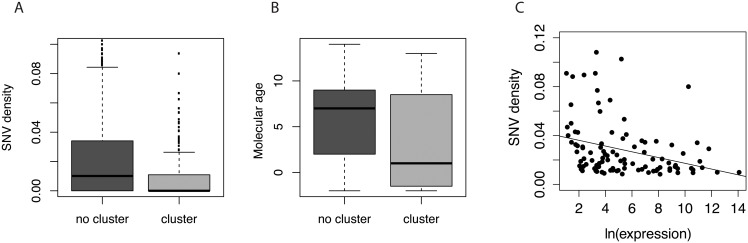
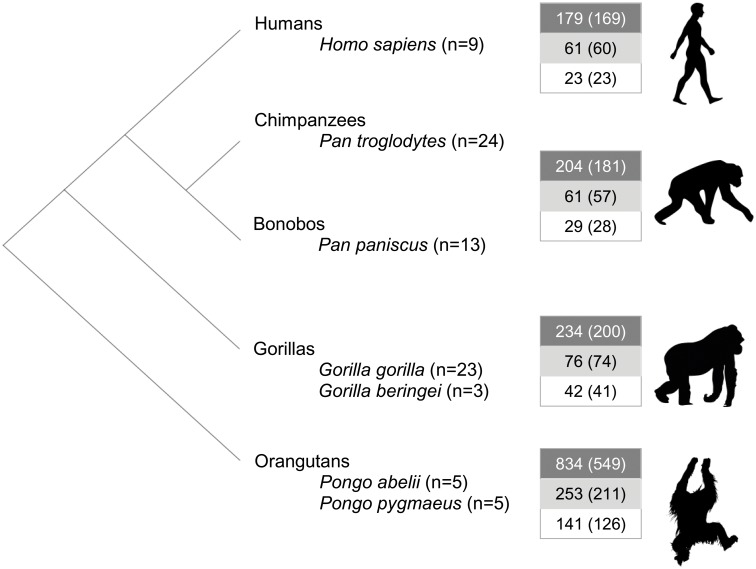
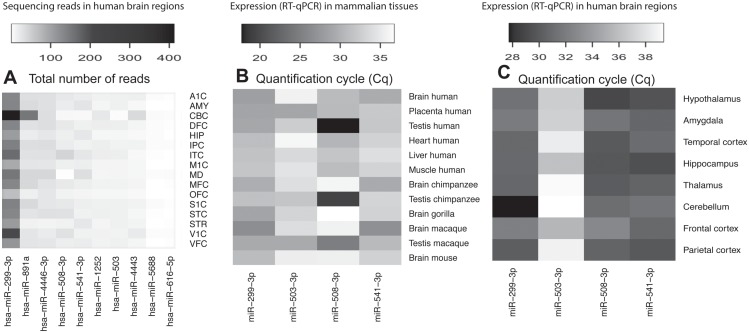
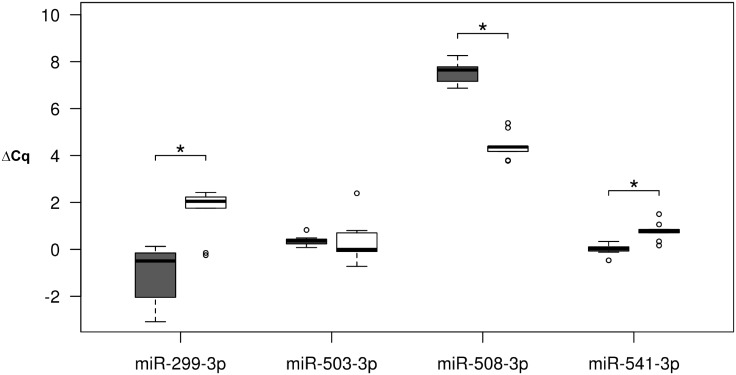
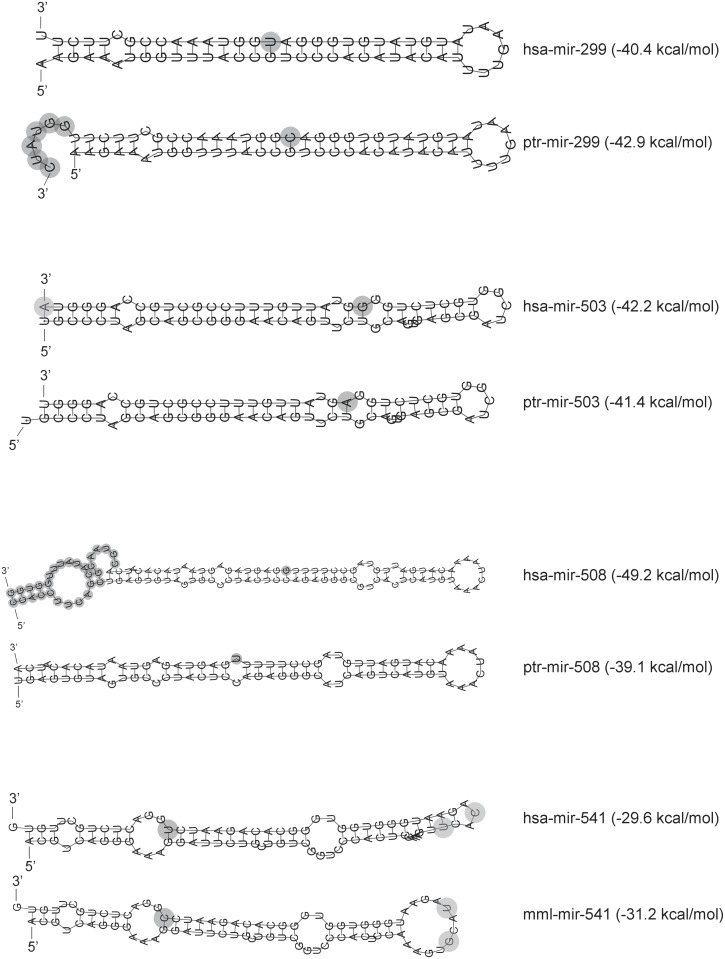
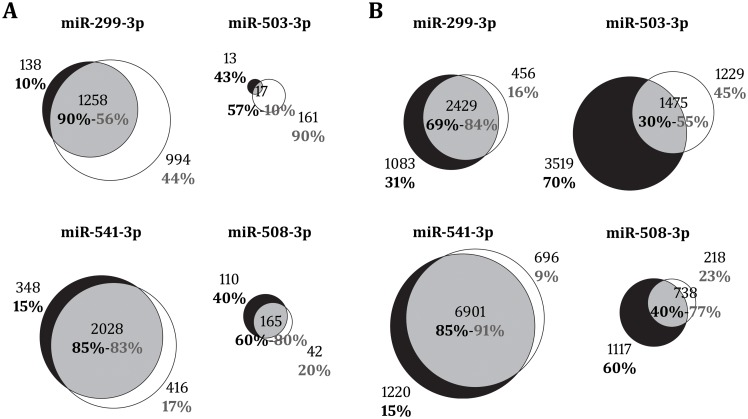
microRNAs are crucial post-transcriptional regulators of gene expression involved in a wide range of biological processes. Although microRNAs are highly conserved among species, the functional implications of existing lineage-specific changes and their role in determining differences between humans and other great apes have not been specifically addressed. We analyzed the recent evolutionary history of 1,595 human microRNAs by looking at their intra- and inter-species variation in great apes using high-coverage sequenced genomes of 82 individuals including gorillas, orangutans, bonobos, chimpanzees and humans. We explored the strength of purifying selection among microRNA regions and found that the seed and mature regions are under similar and stronger constraint than the precursor region. We further constructed a comprehensive catalogue of microRNA species-specific nucleotide substitutions among great apes and, for the first time, investigated the biological relevance that human-specific changes in microRNAs may have had in great ape evolution. Expression and functional analyses of four microRNAs (miR-299-3p, miR-503-3p, miR-508-3p and miR-541-3p) revealed that lineage-specific nucleotide substitutions and changes in the length of these microRNAs alter their expression as well as the repertoires of target genes and regulatory networks. We suggest that the studied molecular changes could have modified crucial microRNA functions shaping phenotypes that, ultimately, became human-specific. Our work provides a frame to study the impact that regulatory changes may have in the recent evolution of our species.


Conflict of interest statement

Competing Interests: The authors declare that “Parc Zoològic de Barcelona” and Copenhagen Zoo participations do not alter our adherence to PLOS ONE policies on sharing data and materials.

Figures

Fig 1
Fig 1. Variation across miRNA (precursor, mature and seed) and flanking (3’ and 5’) regions, in the great ape populations.
(A) Single nucleotide variant (SNV) density calculated as the average number of fixed substitutions in concatenated regions within each population. (B) Boxplot showing standardized (Z-score) nucleotide diversity (pi). (C) Average PhastCons conservation scores. Regions with no statistically significant differences share the same color. Asteriks represent statistically significant differences. Error bars in (A) and (C) represent the standard error of the mean.
Fig 2
Fig 2. miRNA conservation in clustered and non-clustered miRNAs.
(A) Single nucleotide variant (SNV) density in clustered or non-clustered miRNAs, calculated as the average number of fixed substitutions in any of the great ape populations across the precursor miRNA. (B) Molecular age of clustered and non-clustered miRNAs. Molecular age is taken from Iwama et al. [17] were each integer represents a period of origin with the oldest miRNAs having a value of -1 (right after the split between mammals and birds) and the youngest a value of 13 (after the split between humans and chimpanzees). (C) Correlation between SNV density and expression, calculated as the average expression values for miRNAs across five human tissues (cerebellum, brain, heart, kidney and testis) taken from Meunier et al. [16].
Fig 3
Fig 3. Great ape individuals and miRNAs changes analyzed in this study.
Boxes indicate the number of species-specific nucleotide substitutions along the great ape phylogeny since the split with humans (or with chimpanzees in the case of humans), in the precursor (dark grey), mature (light grey) and seed (white) miRNA regions. Total number of miRNAs in which these changes occur is shown in brackets. No species-specific nucleotide substitutions were considered for bonobo (Pan paniscus) due to the low quality genome annotation in this group may underestimate the real number of species-specific substitutions in the rest of the groups, and for gorillas (Gorilla beringei) due to the low number of individuals that are representative of this population.
Fig 4
Fig 4. miRNA expression levels.
(A) Expression levels represented as total number of sequencing reads of the ten miRNAs with human-specific substitutions in the mature or seed region and with the highest expression levels across brain regions (values taken from Allan Brain Atlas) [32]. (B-C) Expression levels of miR-299-3p, miR-503-3p, miR-508-3p and miR-541-3p measured by RT-qPCR in different mammalian tissues (B) and in different human brain regions (C). Brain regions in (A) are A1C: primary auditory cortex (core); AMY: amygdaloid complex; CBC: cerebellar cortex; DFC: dorsolateral prefrontal cortex; HIP: hippocampus (hippocampal formation); IPC: posteroinferior (ventral) parietal cortex; ITC: inferolateral temporal cortex (area TEv, area 20); M1C: primary motor cortex (area M1, area 4); MD: mediodorsal nucleus of thalamus; MFC: anterior (rostral) cingulate (medial prefrontal) cortex; OFC: orbital frontal cortex; S1C: primary somatosensory cortex (area S1, areas 3,1,2); STC: posterior (caudal) superior temporal cortex (area TAc); STR: striatum; V1C: primary visual cortex (striate cortex, area V1/17); VFC: ventrolateral prefrontal cortex. Brain tissues in (B) correspond to frontal cortex in all species.
Fig 5
Fig 5. miRNA expression level differences between miRNA variants.
Differences in the expression levels (ΔCq) measured by RT-qPCR in transfected HeLa cells for the studied miRNAs between the human (grey, left) and non-human (white, right) miRNAs. ΔCq represents the difference between the control reference miRNA and each miRNA variant. Asterisks indicate p < 0.05 in the t-test comparisons.
Fig 6
Fig 6. Hairpin structures and stabilities of the studied miRNAs.
Minimum free energy (MFE) and secondary structure predictions for human (hsa), chimpanzee (ptr) and macaque (mml) miRNA precursor sequences (miRBase, release 21), according to RNAfold. Grey circles represent nucleotide changes between miRNAs.
Fig 7
Fig 7. Deregulated and target genes of the studied miRNAs.
(A) Number of deregulated genes for human (black), non-human (white) and both (grey) miRNA variants from microarray experiments in transfected SH-SY5Y cells. Deregulated genes were obtained based on the fold change in gene expression (adjusted p < 0.05; fold change > 1.2) when comparing cells transfected with the studied miRNA mimic variants and cells transfected with the negative control. (B) Number of target genes predicted by PITA algorithm (ΔΔG score ≤ -10) for the studied miRNAs for human (black), non-human (white) and both (grey) miRNA variants. Percentages indicate the portion of exclusive (outside the intersection) or common (inside the intersection) genes among the total number of regulated (A) or target (B) genes for each variant.

References

    1. Nowick K, Gernat T, Almaas E, Stubbs L. Differences in human and chimpanzee gene expression patterns define an evolving network of transcription factors in brain. Proc Natl Acad Sci U S A. 2009;106: 22358–22363. 10.1073/pnas.0911376106 - DOI - PMC - PubMed
    1. Perdomo-Sabogal A, Kanton S, Walter MBC, Nowick K. The role of gene regulatory factors in the evolutionary history of humans. Curr Opin Genet Dev. Elsevier Ltd; 2014;29: 60–67. 10.1016/j.gde.2014.08.007 - DOI - PubMed
    1. Esquela-Kerscher A, Slack FJ. Oncomirs—microRNAs with a role in cancer. Nat Rev Cancer. 2006;6: 259–69. 10.1038/nrc1840 - DOI - PubMed
    1. Bartel DP. MicroRNAs: target recognition and regulatory functions. Cell. 2009;136: 215–33. 10.1016/j.cell.2009.01.002 - DOI - PMC - PubMed
    1. Saba R, Schratt GM. MicroRNAs in neuronal development, function and dysfunction. Brain Res. Elsevier B.V.; 2010;1338: 3–13. 10.1016/j.brainres.2010.03.107 - DOI - PubMed

Publication types

MeSH terms