. 2016 Apr 21;62(2):157-168.
doi: 10.1016/j.molcel.2016.03.019.

Methylome-wide Analysis of Chronic HIV Infection Reveals Five-Year Increase in Biological Age and Epigenetic Targeting of HLA

Affiliations

Methylome-wide Analysis of Chronic HIV Infection Reveals Five-Year Increase in Biological Age and Epigenetic Targeting of HLA

Andrew M Gross et al. Mol Cell. .

Abstract

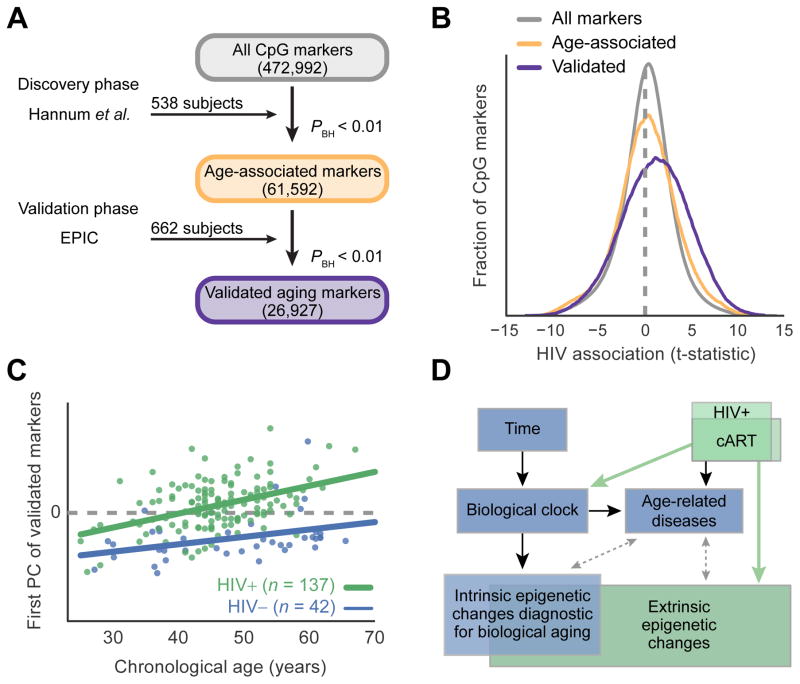
HIV-infected individuals are living longer on antiretroviral therapy, but many patients display signs that in some ways resemble premature aging. To investigate and quantify the impact of chronic HIV infection on aging, we report a global analysis of the whole-blood DNA methylomes of 137 HIV+ individuals under sustained therapy along with 44 matched HIV- individuals. First, we develop and validate epigenetic models of aging that are independent of blood cell composition. Using these models, we find that both chronic and recent HIV infection lead to an average aging advancement of 4.9 years, increasing expected mortality risk by 19%. In addition, sustained infection results in global deregulation of the methylome across >80,000 CpGs and specific hypomethylation of the region encoding the human leukocyte antigen locus (HLA). We find that decreased HLA methylation is predictive of lower CD4 / CD8 T cell ratio, linking molecular aging, epigenetic regulation, and disease progression.


Figures

Figure 1
Figure 1. Shared epigenetic signature of HIV infection and aging
A, Discovery and validation of CpG methylation markers associated with age. B, Distribution of t-statistics measuring association of each methylation marker with HIV status. Colors indicate groups of markers identified in (A): Gray, all markers; yellow, age-associated markers from discovery phase; violet, subset of age-associated markers confirmed in validation. C, Principal component (PC) analysis of the validated age-associated markers, in which the first PC (y-axis) is positively associated with both age (x-axis) and disease status (HIV+, green; HIV−, blue). D, Potential relationships among HIV infection, epigenetics, disease, and aging. Black: known; Dashed gray: potential; Green: connections explored in this study. See also Table S2 and Table S3.
Figure 2
Figure 2. Epigenetic models accurately predict age and indicate advanced aging for HIV-infected individuals
A, Scatter plot comparing the ages predicted using the Hannum et al. and Horvath models on healthy controls (n = 1,246 from HIV−, Hannum et al. and EPIC datasets). Red points indicate patients that were discarded due to disagreement between the two aging models (n = 66). B–C, Accuracy of the consensus model (y-axis) to predict true chronological age (x-axis) in datasets from Hannum et al. (n = 497, B) or EPIC (n = 637, C). Panels (A–C) show patients between 25 and 68 years old. D, Scatter plot of predicted biological age (consensus aging model) versus chronological age for HIV− healthy controls. E, Scatter plot of biological time versus chronological time since HIV onset for infected subjects. F, Violin plots showing the distribution of residuals from regression of biological versus chronological age. Three groups are shown: HIV− controls, short-term HIV+ infected individuals, and long-term HIV+ infected individuals. Note that the red circle indicates an outlier, which is not used to fit the violin profile, but is used in all statistical assessments. A–E, Black dashed lines indicate diagonal (y = x). r, Pearson’s correlation coefficient. ** indicates P < 10−5. See also Table S4.
Figure 3
Figure 3. Age advancement in validation cohorts of purified cells
A–B, Unsupervised principal component (PC) analysis of methylation patterns in purified blood cell types, in which the first PC is positively associated with both age (x-axis) and disease status (HIV+, green; HIV- blue). (A) New CD4+ T-cell cohort across 5999 markers that are age-associated in CD4+ T-cells (GSE59250). (B) New neutrophil cohort across markers probes that are age-associated in neutrophils (GSE65097). C–F, Control (C–D) and HIV+ (E–F) subjects for sorted cell validation datasets comparing chronological age to the Hannum et al. epigenetic aging model in neutrophils (C, E) and consensus aging model in CD4+ T-cells (D, F). G–H, Violin plots showing age advancement in the two sorted cell datasets. For B, in initial analysis the first PC heavily reflected an outlier point, which was removed for this analysis after which the PC was recalculated. See also Figure S2.
Figure 4
Figure 4. HIV and aging have shared and distinct methylation patterns
A, Overlap table comparing the set of CpG markers associated with HIV and the set of validated age-associated markers (see Figure 1A). Numbers indicate probe counts in each overlap, colors correspond to odds ratio of overlap compared to background. B, Odds ratios of enrichment for a panel of genomic features, evaluated in sets of markers associated with age, HIV, or both. PRC2, polycomb repressive complex 2 binding sites; DHS, DNase hypersensitivity sites; TSS, transcription start sites. C, Distribution of methylation states for the CpG marker sets defined in (A). See also Table S2 and Table S6.
Figure 5
Figure 5. Methylome remodeling under sustained HIV infection targets HLA
A, Epigenome-wide association of CpG methylation (mCpG) with HIV status (presence or absence). Each point represents the P-value of enrichment for differentially methylated CpG markers within a bin of ±100 consecutive markers along the genome. B–C, P-values of genome-wide association of single nucleotide polymorphisms (SNP) with host control of HIV, reproduced from Fellay et al. D, Epigenome-wide association of mCpG with HIV status (presence or absence), zoomed in to target histone/HLA locus. E–F, Validation screen of HIV-downregulated markers in purified populations of neutrophils (E) and CD4+ T-cells (F). See also Table S2 and Figure S6.

Comment in

References

    1. Althoff KN, McGinnis KA, Wyatt CM, Freiberg MS, Gilbert C, Oursler KK, Rimland D, Rodriguez-Barradas MC, Dubrow R, Park LS, et al. Comparison of Risk and Age at Diagnosis of Myocardial Infarction, End-Stage Renal Disease, and Non-AIDS-Defining Cancer in HIV-Infected Versus Uninfected Adults. Clin Infect Dis 2014 - PMC - PubMed
    1. Ambrosi A, Glad IK, Pellin D, Cattoglio C, Mavilio F, Di Serio C, Frigessi A. Estimated comparative integration hotspots identify different behaviors of retroviral gene transfer vectors. PLoS Comput Biol. 2011;7:e1002292. - PMC - PubMed
    1. Appay V, Rowland-Jones SL. Premature ageing of the immune system: the cause of AIDS? Trends Immunol. 2002;23:580–585. - PubMed
    1. Apps R, Qi Y, Carlson JM, Chen H, Gao X, Thomas R, Yuki Y, Del Prete GQ, Goulder P, Brumme ZL, et al. Influence of HLA-C expression level on HIV control. Science. 2013;340:87–91. - PMC - PubMed
    1. Aryee MJ, Jaffe AE, Corrada-Bravo H, Ladd-Acosta C, Feinberg AP, Hansen KD, Irizarry RA. Minfi: a flexible and comprehensive Bioconductor package for the analysis of Infinium DNA methylation microarrays. Bioinformatics. 2014;30:1363–1369. - PMC - PubMed

Publication types

MeSH terms