. 2016 Apr 21;62(2):194-206.
doi: 10.1016/j.molcel.2016.03.036.

Metabolic Regulation of Gene Expression by Histone Lysine β-Hydroxybutyrylation

Affiliations

Metabolic Regulation of Gene Expression by Histone Lysine β-Hydroxybutyrylation

Zhongyu Xie et al. Mol Cell. .

Abstract

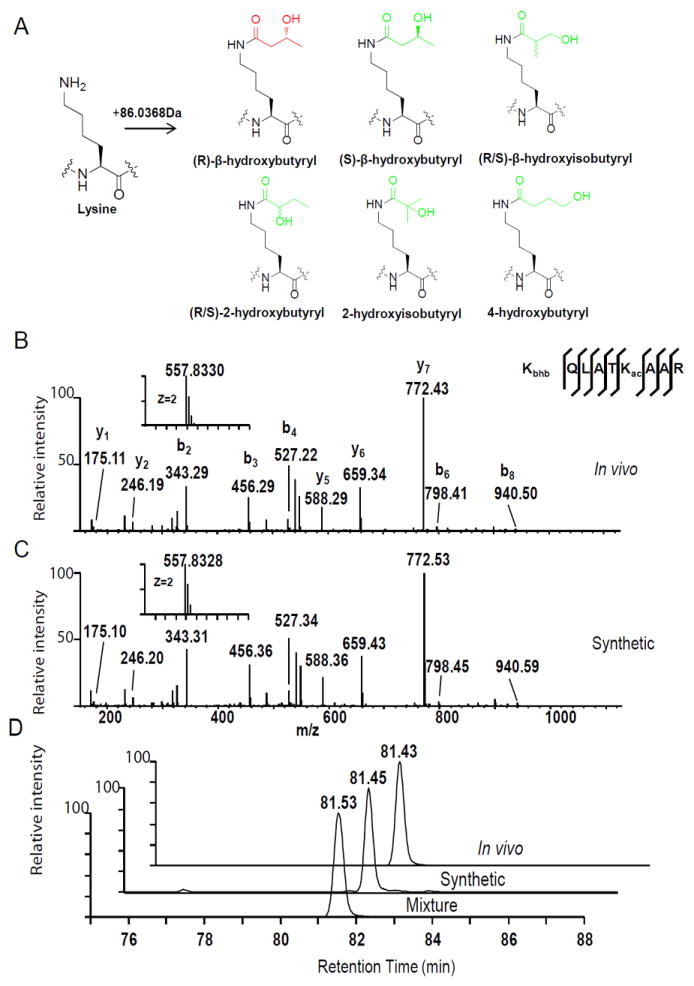
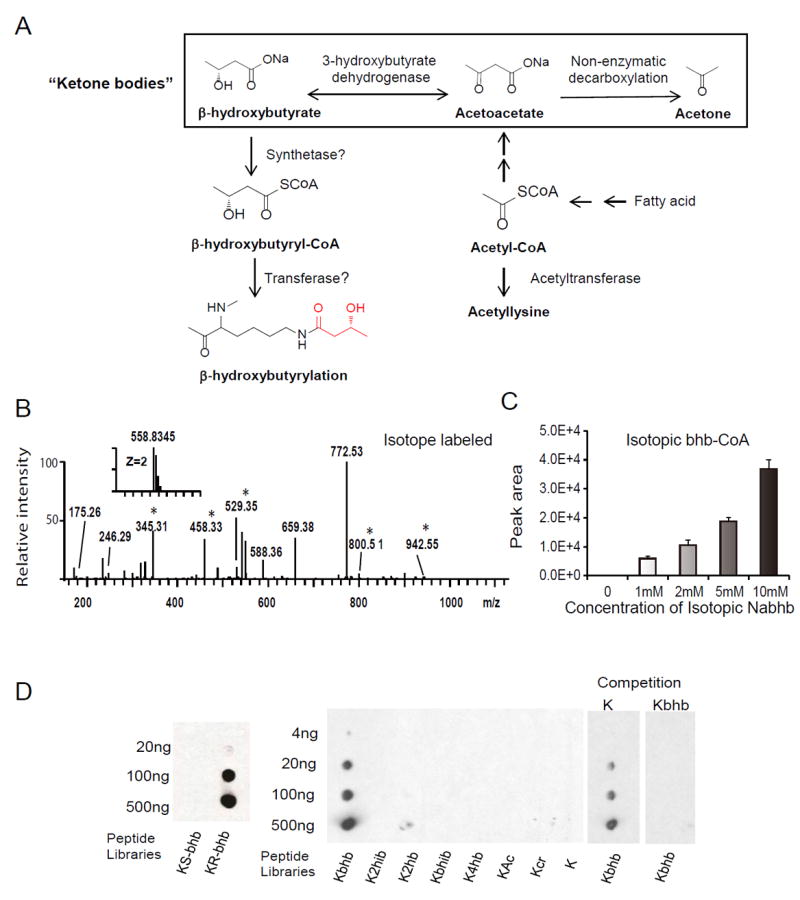
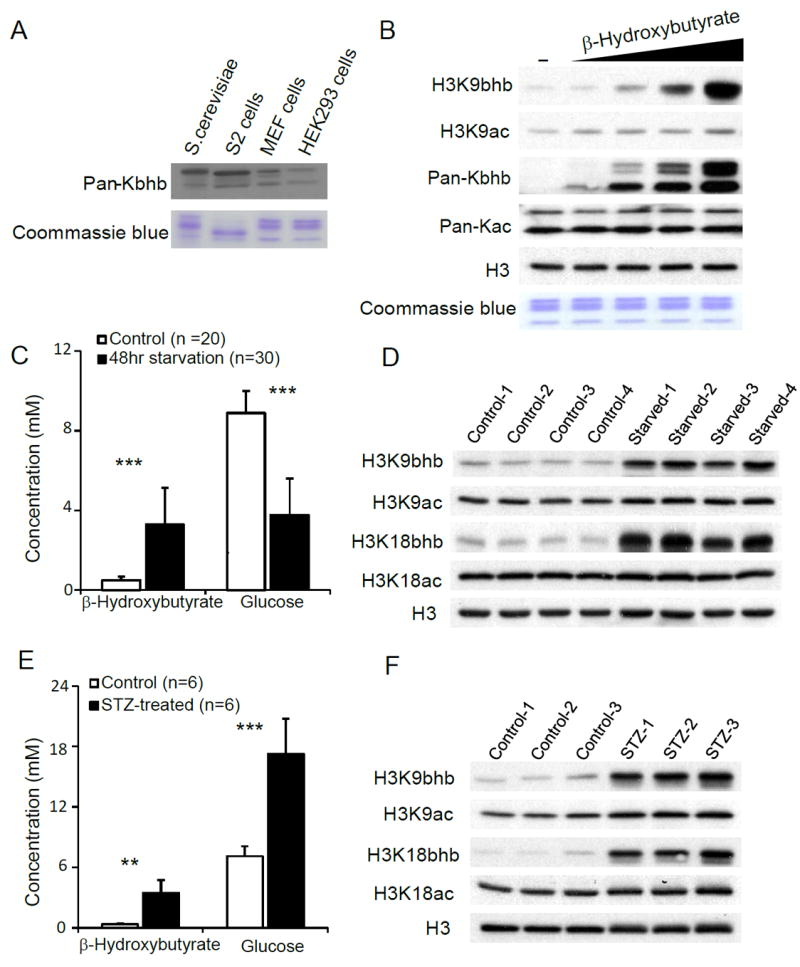
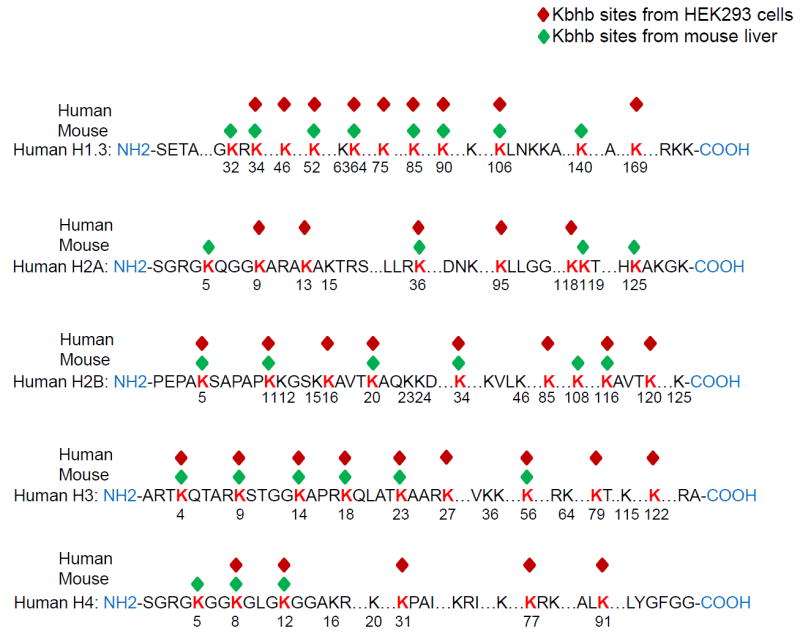
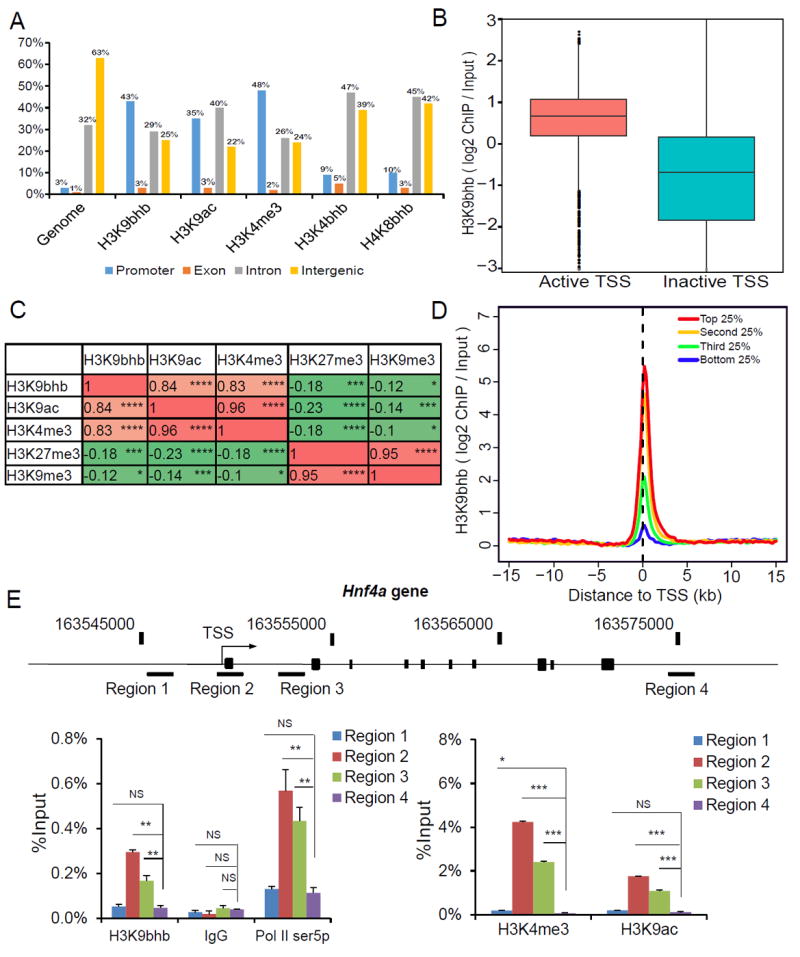
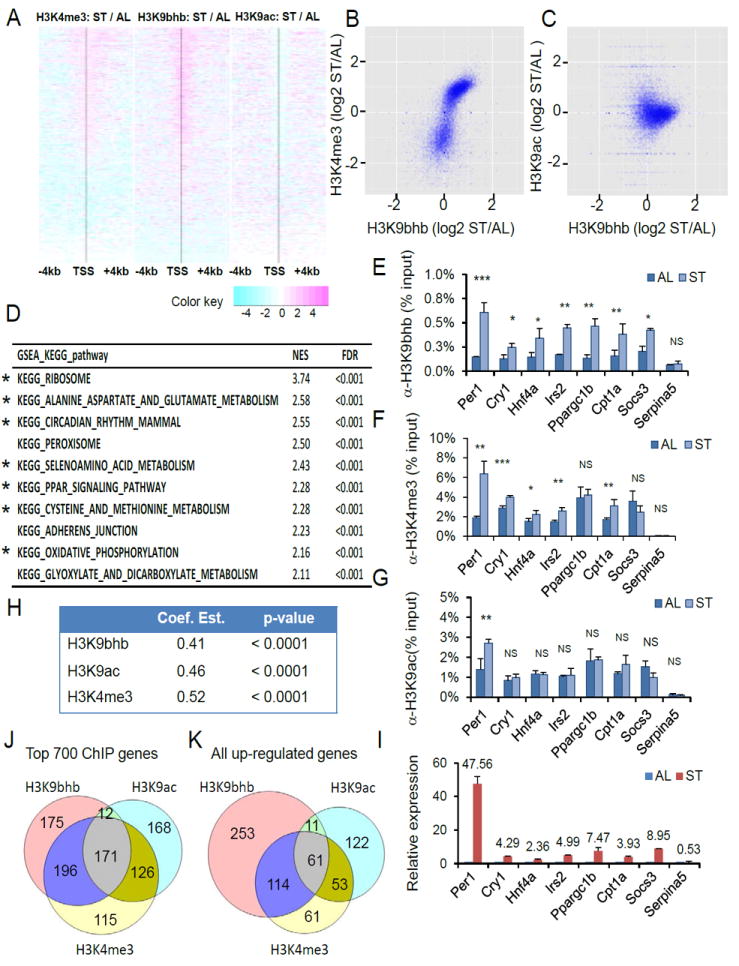
Here we report the identification and verification of a β-hydroxybutyrate-derived protein modification, lysine β-hydroxybutyrylation (Kbhb), as a new type of histone mark. Histone Kbhb marks are dramatically induced in response to elevated β-hydroxybutyrate levels in cultured cells and in livers from mice subjected to prolonged fasting or streptozotocin-induced diabetic ketoacidosis. In total, we identified 44 histone Kbhb sites, a figure comparable to the known number of histone acetylation sites. By ChIP-seq and RNA-seq analysis, we demonstrate that histone Kbhb is a mark enriched in active gene promoters and that the increased H3K9bhb levels that occur during starvation are associated with genes upregulated in starvation-responsive metabolic pathways. Histone β-hydroxybutyrylation thus represents a new epigenetic regulatory mark that couples metabolism to gene expression, offering a new avenue to study chromatin regulation and diverse functions of β-hydroxybutyrate in the context of important human pathophysiological states, including diabetes, epilepsy, and neoplasia.


Figures

Figure 1
Figure 1. Identification and Verification of Lysine β-hydroxybutyrylation
(A) Chemical structures of eight possible isomers that can cause a mass shift of +86.0368 Da. (B, C) MS/MS spectra of a tryptic peptide derived from HEK293 core histones (B) and the synthetic peptide (C). Kac indicates acetyllysine and Kbhb indicates β-hydroxybutyryllysine. The insets show the mass-to-charge ratios (m/z) of the doubly charged precursor peptide ions. The x and y axis represents m/z and relative ion intensity, respectively. (D) Reconstructed ion chromatograms from HPLC/MS/MS analyses of the in vivo-derived peptide, its synthetic Kbhb counterpart, and their mixture, showing co-elution of the two peptides. The x and y axis represent retention time of HPLC/MS analysis and the MS signal, respectively. See also Figure S1.
Figure 2
Figure 2. Metabolic Labelling of Histone Kbhb Marks by Isotopic β-Hydroxybutyrate
(A) Biosynthetic pathways for β-hydroxybutyrate and β-hydroxybutyryl-CoA. Also depicted are the three ketone bodies: β-hydroxybutyrate, acetoacetate, and acetone. (B) MS/MS spectra of a tryptic peptide identified from (R/S)-β-hydroxybutyrate-[2, 4-13C2]-treated HEK293 cells. An asterisk indicates a mass shift induced by isotopic labelling. (C) MS detection of isotopic β-hydroxybutyryl-CoA from HEK293 cells treated with the indicated concentration of isotopic R-sodium β-hydroxybutyrate (13C4). Data are represented as means (±SEM) of three independent experiments. (D) Specificity of pan anti-Kbhb antibody revealed by dot-blot and competition assay. Dot-blot assay was carried out using pan anti-Kbhb antibody and indicated amount of modified peptide libraries. The libraries were composed of mixtures of CXXXXKXXXX peptides, where C is cysteine, X is a mixture of all 19 amino acids except for cysteine, and the 6th residual is a lysine: R- or S-β-hydroxybutyryl lysine (Kbhb) (left panel); R-β-hydroxybutyryl lysine, 2-hydroxyisobutyryl lysine (K2hib), 2-hydroxybutyryl lysine (K2hb), β-hydroxyisobutyryl lysine (Kbhib), 4-hydroxybutyryl lysine (K4hb), acetyl lysine (Kac), crotonyl lysine (Kcr), or unmodified lysine (K) (middle panel). Competition was carried out by incubation of pan anti-Kbhb antibodies with 10-fold excess of unmodified or Kbhb containing peptides (right panel). See also Figure S2.
Figure 3
Figure 3. Histone β-Hydroxybutyrylation is Metabolically Regulated by Cellular β-Hydroxybutyrate Levels
(A) Immunoblot analysis of histones from S. cerevisiae, D. melanogaster S2 cells, MEF cells, and HEK293 cells using pan anti-Kbhb antibody. (B) Immunoblot analysis of histones from HEK293 cells treated with dose-increased sodium β-hydroxybutyrate. (C) Blood glucose and β-hydroxybutyrate concentrations measured by a glucose-ketone meter from “fed” or “fasted” mice. Data are represented as means (±SEM). Twenty “fed” and 30 “fasted” mice were used. **P < 0.01, ***P < 0.001. (D) Histone Kbhb and Kac levels in livers from “fed” or “fasted” mice were detected by Western blot using indicated antibodies. (E) Blood glucose and β-hydroxybutyrate concentrations measured from “healthy” or “STZ-treated” mice. Data are represented as means (±SEM). Six pairs of healthy and streptozotocin (STZ) treated mice were used. **P < 0.01, ***P < 0.001. (F) Histone Kbhb and Kac levels in livers from “healthy” or “STZ-treated” mice were detected by Western blot using indicated antibodies. See also Figure S3.
Figure 4
Figure 4. Proteomic Screening of Histone Kbhb Sites in Human and Mouse Cells
Modified Lysine residues are highlighted in red. See also Data S1-S3 for the corresponding MS/MS spectra.
Figure 5
Figure 5. Genome-Wide Localization of Histone Kbhb Marks
(A) Genome wide distribution of histone Kbhb in liver cells. Bar plot showing histone H3K4me3, H3K9ac, H3K9bhb, H3K4bhb, H4K8bhb and a random distribution of peaks of similar size (genome) over promoter (blue), intron (red), exon (purple) and intergenic regions (green). The promoter is defined as regions ± 2kb around known transcription start sites (TSSs). (B) H3K9bhb signal (log2 ChIP/ input) in active and inactive TSSs. Active TSSs were defined as TSSs corresponding to the top 20% most expressed genes. Similarly, inactive TSSs were defined as TSSs corresponding to 20% lowest expressed genes. (C) Pearson correlation coefficient estimates of H3K9bhb enrichment with either active histone marks or repressive marks, calculated using log10-transformed ChIP read counts in either promoter regions (H3K9bhb, H3K9ac, and H3K4me3) or gene bodies (H3K27me3 and H3K9me3). * (p <0.05), ** (p < 0.01), *** (p < 0.001), and **** (p < 0.0001). (D) H3K9bhb signal intensity (Scaled log2 ChIP/ input) in promoter regions with the top 25%, the second 25%, the third 25%, and the bottom 25% RNA-seq counts. (E) ChIP-qPCR analysis of histone H3K9bhb, H3K9ac, H3K4me3 and RNA Pol II (Ser5p) distribution on the Hnf4a gene. Data are represented as means (±SEM) of three independent experiments. NS (p > 0.05), * (p <0.05), ** (p < 0.01), and *** (p < 0.001). See also Figure S4.
Figure 6
Figure 6. Starvation-Induced H3K9bhb increase is Associated with Active Gene Expression
(A) Heat map showing changes of H3K9bhb-, H3K9ac-, and H3K4me3- ChIP-seq signals around promoter regions (± 4kb around TSS). The order of genes are same in all the three heat maps, which were based on the ChIP-seq read counts of H3K4me3 marks in starvation (ST) condition. The black vertical line in each heat map indicates location of TSS and changes in signals were presented in logarithm scale. (B) Correlation between changes in ChIP-seq signals of H3K9bhb and those of H3K4me3 upon starvation. Library sizes of ChIP-seq data were normalized between “starvation” (ST) and “fed” (AL) conditions, for each modification. Coef. Est. = 0.57, p-value < 0.0001. (C) Correlation between changes in ChIP-seq signals of H3K9bhb and those of H3K9ac upon starvation. Library sizes of ChIP-seq data were normalized between “starvation” (ST) and “fed” (AL) conditions, for each modification. Coef. Est. = -0.03, p-value = 0.5274. (D) KEGG pathway analysis of H3K9bhb ChIP-seq data using Gene Set Enrichment Analysis (GSEA). The top 10 H3K9bhb-enriched pathways in response to starvation were listed, in the order of normalized enriched score (NES). The asterisk marked the same pathways appeared in Figure S5D. See also the list of genes and their rankings in Table S4. (E-G) qPCR analysis of H3K9bhb-, H3K4me3-, and H3K9ac- ChIP products from mouse livers either fed normally or fasted for 48 hours. Data are represented as means ±SEM (n=3). NS (p > 0.05), * (p <0.05), ** (p < 0.01), and *** (p < 0.001). (H) Pearson correlation coefficient estimates representing the correlation between induced gene expression and increased histone marks of interest. P-values were calculated using t-distribution. (I) RT-qPCR analysis of gene expression during 48h of fasting. Relative expression was normalized to Actin. Data were represented as mean fold change ± standard deviation in relative expression (fasted vs fed) from three mice each group. Data are represented as means ±SEM (n=3). (J) Venn diagram of up-regulated genes marked by each of the increased histone modifications during starvation. The top 700 genes were chosen based on their fold change of ChIP-seq signals for H3K9bhb, H3K9ac, and H3K4me3 modification during starvation, respectively. The Venn diagram shows the numbers of the top 700 genes with increased gene expression in response to starvation. (K) Starvation-induced genes are associated with increased histone marks. All the 1742 up-regulated genes (log2-transformed fold change in expression of ≥ 0.5) were used to generate this Venn diagram. The number in each circle represents the up-regulated genes in which promoter regions have at least 2-fold increases of ChIP-seq signals of H3K9bhb, H3K9ac, or H3K4me3, respectively. See also Figures S5-S7.

References

    1. ALLEN BG, BHATIA SK, ANDERSON CM, EICHENBERGER-GILMORE JM, SIBENALLER ZA, MAPUSKAR KA, SCHOENFELD JD, BUATTI JM, SPITZ DR, FATH MA. Ketogenic diets as an adjuvant cancer therapy: History and potential mechanism. Redox Biology. 2014;2:963–970. - PMC - PubMed
    1. ALLIS CD, CHICOINE LG, RICHMAN R, SCHULMAN IG. Deposition-related histone acetylation in micronuclei of conjugating Tetrahymena. Proc Natl Acad Sci U S A. 1985;82:8048–52. - PMC - PubMed
    1. BANNISTER AJ, KOUZARIDES T. Regulation of chromatin by histone modifications. Cell Res. 2011;21:381–95. - PMC - PubMed
    1. CAHILL GF. Fuel metabolism in starvation. Annual Review of Nutrition. 2006;26:1–22. - PubMed
    1. CHEN Y, CHEN W, COBB MH, ZHAO Y. PTMap--a sequence alignment software for unrestricted, accurate, and full-spectrum identification of post-translational modification sites. Proc Natl Acad Sci U S A. 2009;106:761–6. - PMC - PubMed

Publication types

MeSH terms