. 2016 May 24;7(21):30935-50.
doi: 10.18632/oncotarget.8817.

Inhibition of SP1 by the mithramycin analog EC-8042 efficiently targets tumor initiating cells in sarcoma

Affiliations

Inhibition of SP1 by the mithramycin analog EC-8042 efficiently targets tumor initiating cells in sarcoma

Juan Tornin et al. Oncotarget. .

Abstract

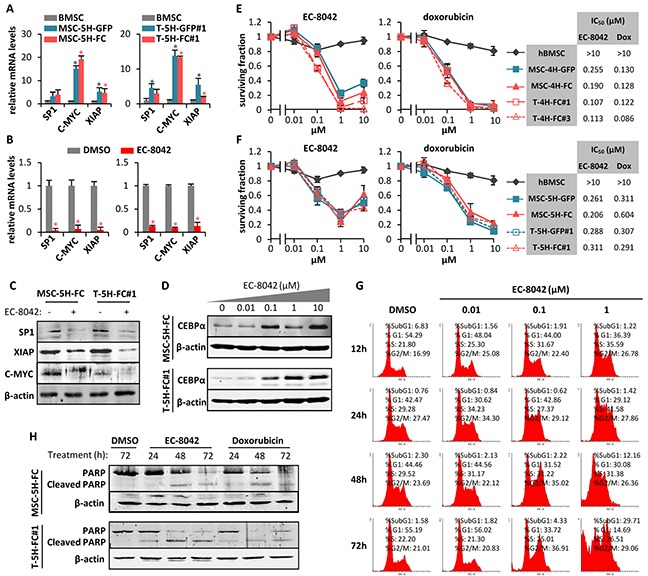
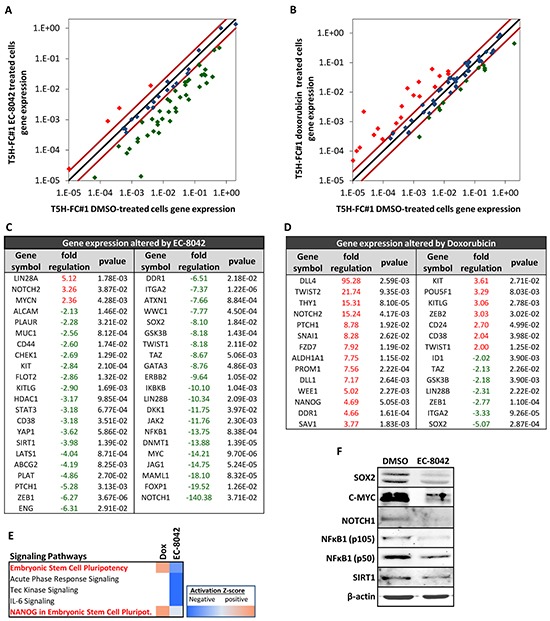
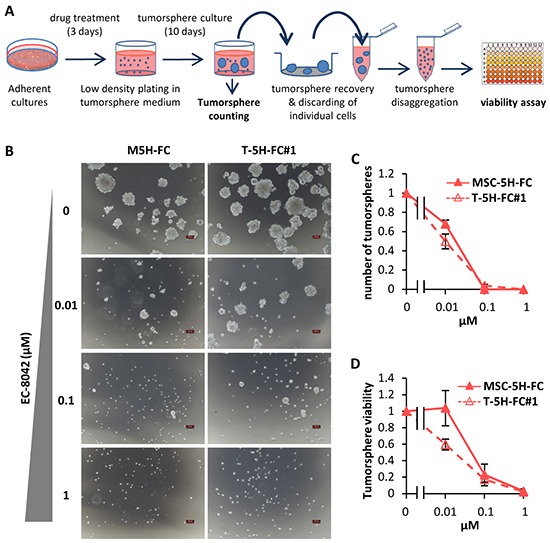
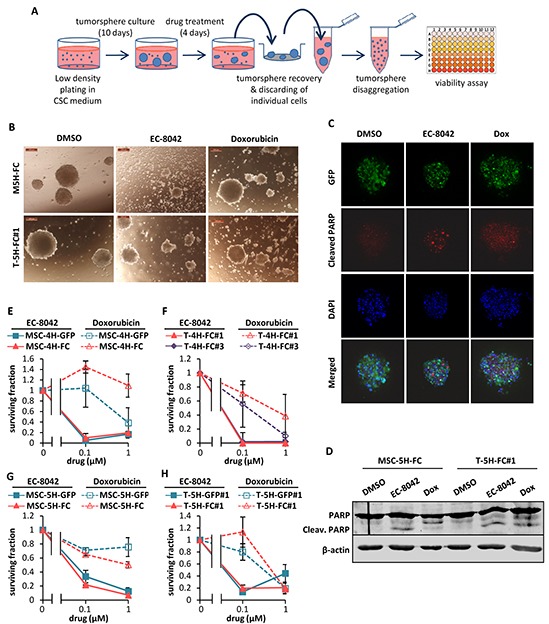
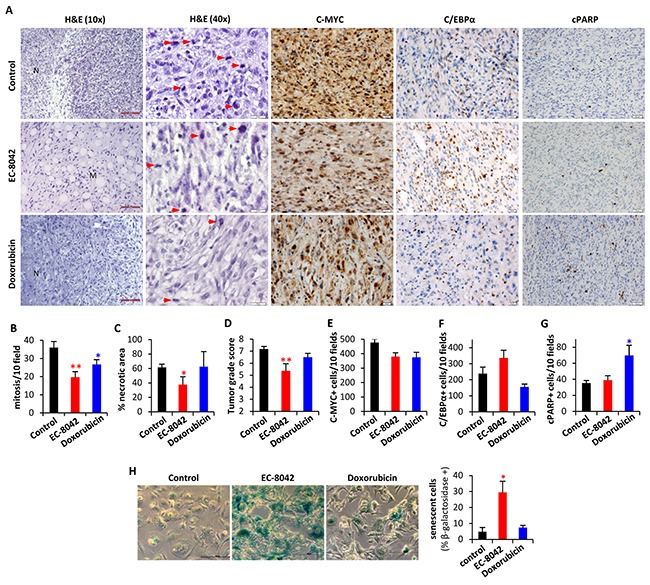
Tumor initiating cells (TICs), responsible for tumor initiation, and cancer stem cells (CSCs), responsible for tumor expansion and propagation, are often resistant to chemotherapeutic agents. To find therapeutic targets against sarcoma initiating and propagating cells we used models of myxoid liposarcoma (MLS) and undifferentiated pleomorphic sarcoma (UPS) developed from human mesenchymal stromal/stem cells (hMSCs), which constitute the most likely cell-of-origin for sarcoma. We found that SP1-mediated transcription was among the most significantly altered signaling. To inhibit SP1 activity, we used EC-8042, a mithramycin (MTM) analog (mithralog) with enhanced anti-tumor activity and highly improved safety. EC-8042 inhibited the growth of TIC cultures, induced cell cycle arrest and apoptosis and upregulated the adipogenic factor CEBPα. SP1 knockdown was able to mimic the anti-proliferative effects induced by EC-8042. Importantly, EC-8042 was not recognized as a substrate by several ABC efflux pumps involved in drug resistance, and, opposite to the chemotherapeutic drug doxorubicin, repressed the expression of many genes responsible for the TIC/CSC phenotype, including SOX2, C-MYC, NOTCH1 and NFκB1. Accordingly, EC-8042, but not doxorubicin, efficiently reduced the survival of CSC-enriched tumorsphere sarcoma cultures. In vivo, EC-8042 induced a profound inhibition of tumor growth associated to a strong reduction of the mitotic index and the induction of adipogenic differentiation and senescence. Finally, EC-8042 reduced the ability of tumor cells to reinitiate tumor growth. These data suggest that EC-8042 could constitute an effective treatment against both TIC and CSC subpopulations in sarcoma.

Keywords: DIG-MSK; cancer stem cells; mesenchymal stem cells; mithralog EC-8042; myxoid liposarcoma.


Conflict of interest statement

L-E.N, P.O, M-A.H and F.M are employees of EntreChem SL. F.M reports ownership of stock in EntreChem SL. All other authors declare they have no competing interests. This does not alter adherence to Oncotarget policies on sharing data and materials.

Figures

Figure 1
Figure 1. Antiproliferative effects of EC-8042
A. mRNA expression of SP1 and SP1-downstream genes (C-MYC and XIAP) in MSC5H-GFP and MSC-5H-FC (left panel) and T-5H-GFP#1 and T-5H-FC#1 cells (right panel) relative to hBMSCs. B. mRNA expression of SP1 and SP1-downstream genes (C-MYC and XIAP) in MSC5H-FC (left panel) and T5H-5H-FC#1 cells (right panel) treated with 0.5μM EC-8042 for 24 hours, relative to untreated (DMSO) controls. C. Protein levels of SP1, C-MYC, XIAP and β-actin in MSC5H-FC and T5H-5H-FC#1 cells treated with 0.5μM EC-8042 for 24 hours. D. C/EBPα protein level upregulation after 48h- (MSC-5H-FC) or 24h-treatment (T-5H-FC#1) with the indicated concentrations of EC-8042. E–F. Cell viability (WST1 assay) measured after the treatment of wild-type hBMSCs and the indicated MSC-4H and T-4H (E) or MSC-5H and T-5H cell lines (F) with increasing concentrations of EC-8042 (left panels) or doxorubicin (middle panels) for 48 hours. IC50 values for each cell type are shown (right panels). G. Time-course evolution of the cell cycle distribution of MSC-5H-FC cells treated with increasing concentrations of EC-8042. H. Apoptotic cleavage of PARP in MSC-5H-FC and T-5H-FC#1 cells treated with 0.5μM EC-8042 or 0.5μM doxorubicin for the indicated times. The expression of β-actin was used as loading control in western blotting analysis. Error bars represents the standard deviation and asterisks indicate a statistically significant difference with the respective control groups (*:p<0.05; two-sided Student t test).
Figure 2
Figure 2. SP1 knockdown mimics EC-8042 antiproliferative effects
A. Protein levels of SP1, C-MYC and cleaved-PARP in MSC-5H-FC cells 48 hours after the transfection of the indicated siRNAs (lanes 1-3) or after a 24 hours-treatment with 0.5μM EC-8042 (lane 4). β-Actin levels are presented as a loading control. B. Effect of siRNAs on the cell viability (WST1 assay relative to siControl values) of MSC-5H-FC cells measured 48 or 72 hours after transfection. Error bars represents the standard deviation (n=3 independent experiments) and asterisks indicate a statistically significant difference with the respective control groups (*:p<0.05, **:p<0.005; two-sided Student t test).
Figure 3
Figure 3. EC-8042 downregulates the expression of ABC transporters and is not a substrate for them
A. Relative mRNA expression of ABCG2, ABCB1 and ABCC1 genes in MSC-5H-GFP and MSC-5H-FC cells treated with the indicated concentrations of EC-8042 for 24 hours. B. ABCG2 and ABCB1 functional inhibition assay for EC-8042 and MTM. Cladribine/Ko243 and digoxin/valspodar were used as negative/positive control drugs for ABCG2 and ABCB1 respectively. C. ABCG2 and ABCB1 functional substrate assay for EC-8042 and MTM. Ko243 and valspodar were used as transporter inhibitors for ABCG2 and ABCB1 respectively. Error bars represents the standard error of the mean (SEM) and asterisks indicate a statistically significant difference with the respective control groups (*:p<0.05; two-sided Student t test).
Figure 4
Figure 4. Changes in CSC-related gene expression induced by EC-8042 and doxorubicin
RNA derived from T5H-FC#1 cells treated with the carrier substance (DMSO) or with 0.5 μM EC-8042 or 0.5 μM doxorubicin for 24 hours were used to analyzed the expression of 86 CSC-related genes (RT2 Profiler™ PCR Array System PAHS-176Z, Qiagen). A–B. Scatter plots representing the expression values in control (DMSO) and EC-8042- (A) or doxorubicin- (B) treated cells for each gene. Genes above and below the dark-red lines are expressed more than two fold up (red symbols) or down (green symbols) in treated versus untreated cells respectively. C–D. List of genes differentially expressed (fold change ≤-2 or ≥2 and p-value (two sided Student t test) < 0.05) after EC-8042 (C) or doxorubicin (D) treatment. E. Comparison of genes differentially expressed after EC-8042 and doxorubicin treatment using the IPA software. The heat map of the mostly altered signaling pathways sorted by their variation in the activation z-score is presented. F. Expression of SOX2, C-MYC, NOTCH1, NFκB1 (p50 and p105) and SIRT1 proteins in T5H-5H-FC#1 cells treated with 0.5μM EC-8042 for 24 hours. The expression of β-actin was used as loading control.
Figure 5
Figure 5. Effect of EC-8042 on tumorsphere-formation capacity
A. Adherent cultures of sarcoma TICs were treated for 3 days with DMSO (carrier substance) or EC-8042. After wards that cells were plated at low density in tumorsphere medium and let to form tumorspheres for 10 days. Tumorspheres formed were scored, recovered, disaggregated and assayed for cell viability. B. Representative images of tumorspheres formed from MSC-5H-FC and T-5H-FC#1 cells treated with the indicated concentrations of EC-8042. Scale bars= 100μm. C–D. The effect of the drugs was estimated by scoring the number of tumorspheres formed relative to the untreated condition (C) or by measuring their cell viability (WST1 assay) (D) (n=3 independent experiments). Error bars represents the standard deviation.
Figure 6
Figure 6. Effect of EC-8042 and doxorubicin on tumorsphere cultures
A. Sarcoma TICs were plated at low density in CSC medium and let to form tumorspheres for 10 days followed by a 4-day treatment with DMSO (carrier substance), EC-8042 or doxorubicin. After treatment, the remaining tumorspheres were recovered, disaggregated and assayed for cell viability. B. Representative images of MSC-5H-GFP and MSC-5H-FC sarcosphere cultures treated with DMSO, 1 μM EC-8042 or 1 μM doxorubicin for 4 days. Scale bars= 200μm. C. Detection of cleaved PARP in GFP-positive T5H-FC#1 tumorspheres treated with DMSO, 0.5μM EC-8042 or 0.5μM doxorubicin for 48h. D. Western blot analysis showing the apoptotic cleavage of PARP in MSC-5H-FC and T-5H-FC#1 tumorsphere cultures treated with DMSO, 0.5μM EC-8042 or 0.5μM doxorubicin for the indicated times. E–H. Cell viability (WST1 assay) measured after the treatment of MSC-4H (E), T-4H (F), MSC-5H (G) and T-5H (H) tumorsphere cultures with the indicated concentrations of EC-8042 or doxorubicin. Error bars represents standard deviation.
Figure 7
Figure 7. EC-8042 inhibits the growth of MLS sarcoma xenografts derived from transformed hMSCs
Mice with established T-5H-FC#1 tumor xenografts were randomly assigned to 3 different groups (n=10, 6 and 5 in control, EC-8042 and doxorubicin groups respectively) and treated i.v. with saline buffer (control), EC-8042 at a dose of 18mg/Kg every 3 days (7 doses) or doxorubicin at a dose of 6 mg/Kg every 7 days (3 doses). A. Curves representing the mean tumor volume of T-5H-FC#1 xenografts during the treatments. Drug efficacy expressed as the percentage of tumor growth inhibition (%TGI) on day 15 is indicated. B. In vivo bioluminescence of tumors generated from luciferase-expressing T5H-FC#1 cells in a 3 mice-cohort of the indicated series at day 8 after the beginning of the indicated treatments. Average radiance values ± standard deviation are presented. C. Kaplan-Meier curves generated using the reaching of a tumor volume of 1000 mm3 as end-point event. D. Representative images (upper panel) and tumor weight (bottom panel) at the end of the experiment. E. Mean body weight of mice during the treatments. Doxorubicin was toxic and caused weight loss during the treatment. F–G. For the evaluation of CSC subpopulations after drug treatments we harvested xenograft tumors (n=3 per group) after a single dose treatment of EC-8042 (50mg/Kg) or doxorubicin (8 mg/kg) and dissociated them into single cells to evaluate the number of tumorspheres formed (F) and the tumor re-initiation ability in limiting dilution assays (G). The number of mice that grew tumors at week 3 and total number of inoculated mice for each condition is indicated (G). TIF was calculated using ELDA software. H. Mean tumor weight for each group at the end of the experiment (week 5). Error bars represents the standard error of the mean (SEM) and asterisks indicate a statistically significant difference in tumor volumes between the EC-8042 or doxorubicin-treated and control groups (*:p<0.05, **:p<0.005, ***: p<0.0005; two-sided Student t test). The log-rank test p value was used to estimate significant differences between control and drug treated groups in Kaplan-Meier analysis. In limiting dilutions assays Pr (>chiSq) referring to the control tumors are indicated.
Figure 8
Figure 8. In vivo anti-tumor activity of EC-8042 is associated to the induction of a senescent-like state
Pathological analysis of T5H-FC#1-generated tumors treated i.v. with saline buffer (control), EC-8042 at a dose of 18mg/Kg every 3 days (7 doses) or doxorubicin at a dose of 6 mg/Kg every 7 days (3 doses). A. H&E staining and immuno-staining detection of C-MYC, C/EBPα and cleaved PARP (cPARP). Necrotic (N) and myxoid (M) areas, and mitotic cells (red arrows) are indicated. Scale bars= 100μm (H&E 10X); 50μm (C-MYC, C/EBPα and c-PARP); and 20 μm (H&E 40X). B–G. Quantification of tumor-related features including mitosis [number of mitotic figures per 10 high power fields (40X)] (B), necrosis (C), tumor grade score according to FNCLCC system (D), C-MYC (E) and C/EBPα (F) nuclear expression [number of cell showing nuclear staining per 10 high power fields (40X)] and apoptotic cells [number of cell showing nuclear staining for c-PARP and displaying apoptotic morphology per 10 high power fields (40X)] (G) in tumors from the indicated series. H. Analysis of senescent-associated β-galactosidase activity in ex vivo-established cell lines derived from tumors of the indicated series (n=4). Representative images (left panels; scale bars= 20 μm) and the quantification of the percentage of β-galactosidase + cells in 10 randomly selected fields (>600 total cells) of each cell line (right panel) are presented. Error bars represents the SEM and asterisks indicate a statistically significant difference in tumor volumes between the EC-8042 or doxorubicin-treated and control groups (*:p<0.05, **:p<0.005; two-sided Student t test).

References

    1. Ryan CW, Desai J. The past, present, and future of cytotoxic chemotherapy and pathway-directed targeted agents for soft tissue sarcoma. Am Soc Clin Oncol Educ Book. 2013:e386–e393. - PubMed
    1. Visvader JE. Cells of origin in cancer. Nature. 2011;469:314–322. - PubMed
    1. Rodriguez R, Rubio R, Menendez P. Modeling sarcomagenesis using multipotent mesenchymal stem cells. Cell Res. 2012;22:62–77. - PMC - PubMed
    1. Xiao W, Mohseny AB, Hogendoorn PC, Cleton-Jansen AM. Mesenchymal stem cell transformation and sarcoma genesis. Clin Sarcoma Res. 2013;3:10. - PMC - PubMed
    1. Frank DA. Targeting transcription factors for cancer therapy. IDrugs. 2009;12:29–33. - PubMed

MeSH terms