

Growth suppression by MYC inhibition in small cell lung cancer cells with TP53 and RB1 inactivation
- PMID: 27105536
- PMCID: PMC5058735
- DOI: 10.18632/oncotarget.8826
Growth suppression by MYC inhibition in small cell lung cancer cells with TP53 and RB1 inactivation
Abstract
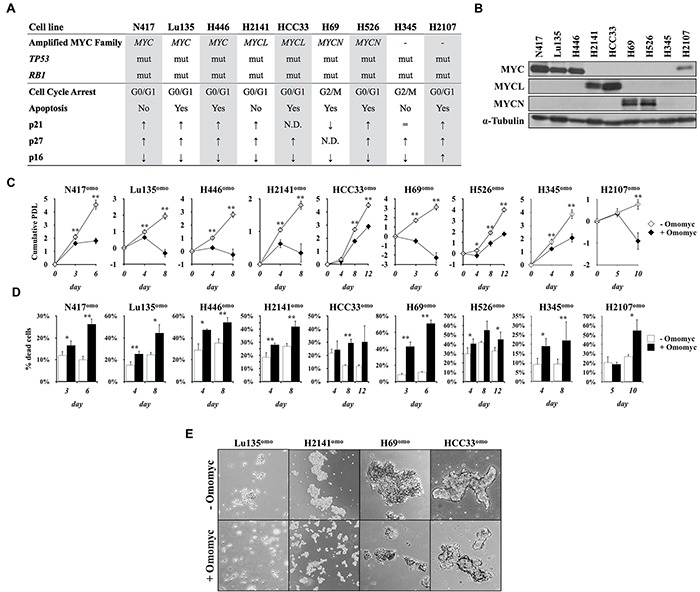
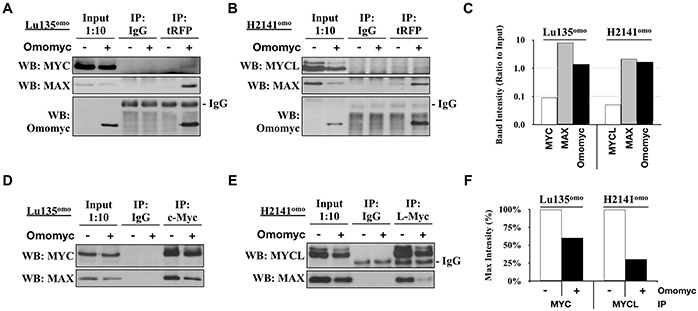
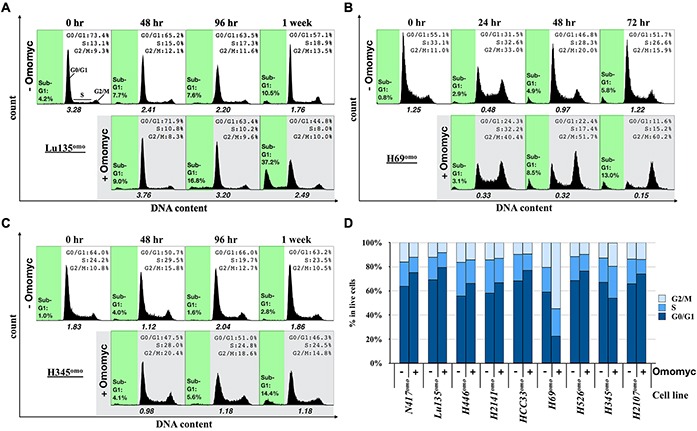
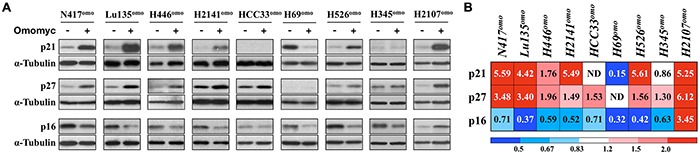
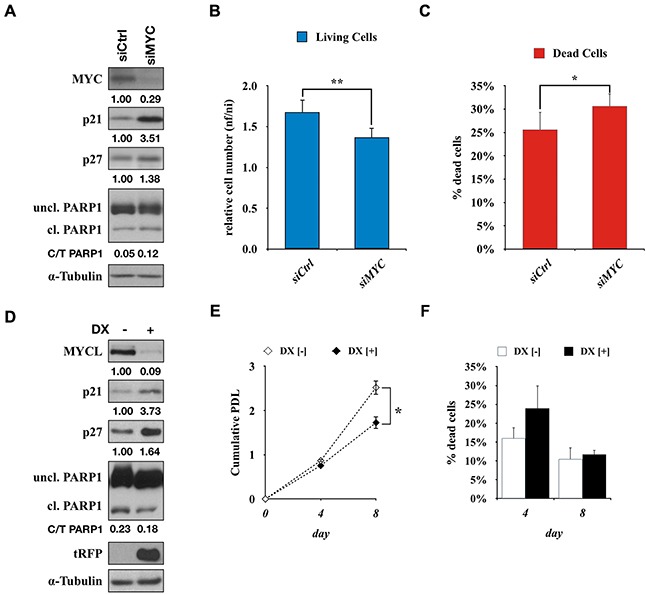
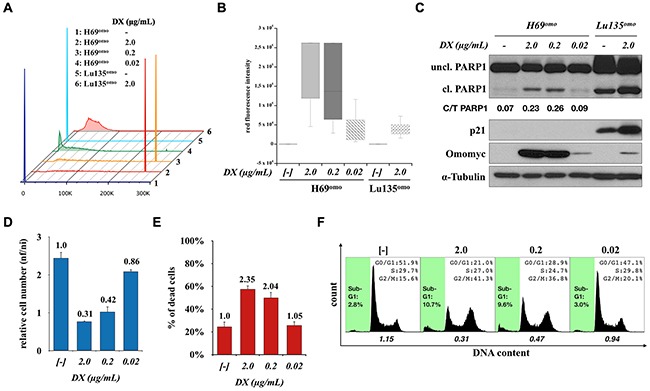
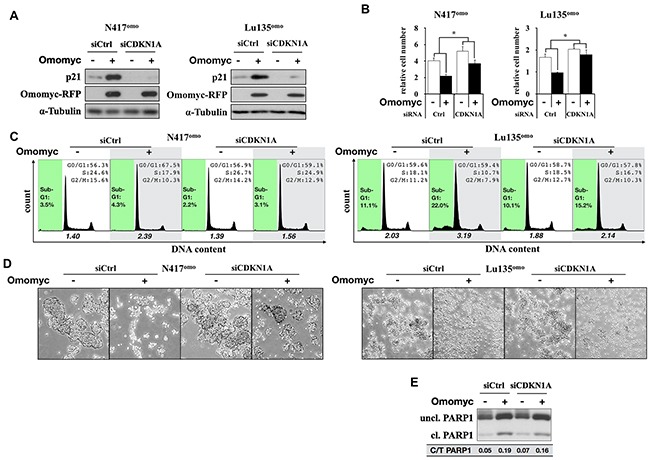
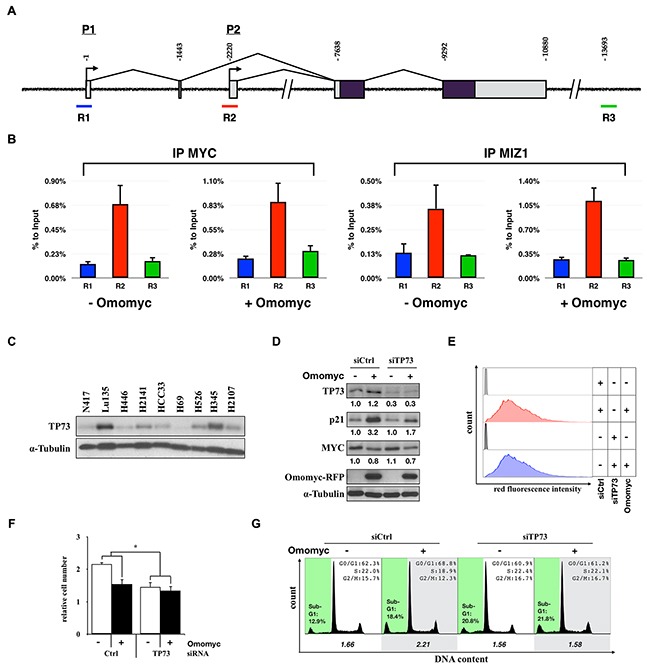
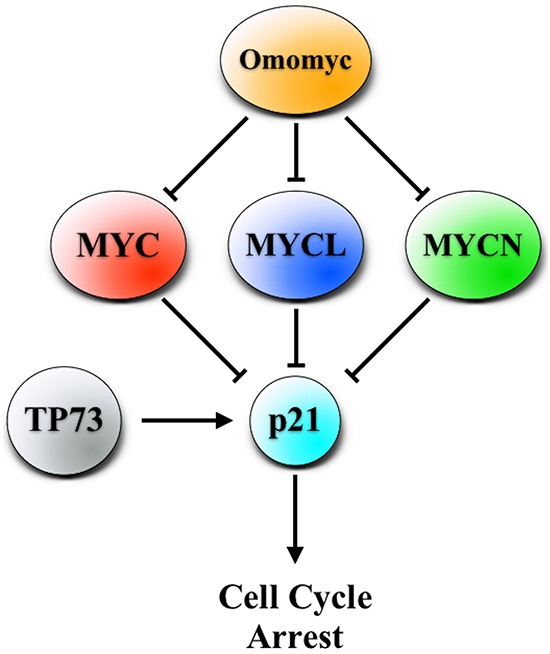
Small cell lung cancer (SCLC) is the most aggressive type of lung cancer with high mortality. One of the MYC family genes, MYC, MYCL or MYCN, is amplified in ~20% of the SCLCs; therefore, MYC proteins are potential therapeutic targets in SCLC patients. We investigated the therapeutic impact of Omomyc, a MYC dominant negative, in a panel of SCLC cell lines. Strikingly, Omomyc suppressed the growth of all tested cell lines by inducing cell cycle arrest and/or apoptosis. Induction of G1 arrest by Omomyc was found to be dependent on the activation of CDKN1A, in part, through the TP73 pathway. Our results strongly indicate that SCLC cells carrying amplification of MYC, MYCL or MYCN are addicted to MYC function, suggesting that MYC targeting would be an efficient therapeutic option for SCLC patients.
Keywords: CDKN1A; MYC; MYCL; SCLC; small cell lung cancer.
Conflict of interest statement
None to be declared.
Figures
Similar articles
-
MYCL is a target of a BET bromodomain inhibitor, JQ1, on growth suppression efficacy in small cell lung cancer cells.Oncotarget. 2016 Nov 22;7(47):77378-77388. doi: 10.18632/oncotarget.12671. Oncotarget. 2016. PMID: 27764802 Free PMC article.
-
Metastatic small cell lung cancer arises from TP53/RB1-deficient and MYC overproduction hESC-derived PNECs.Elife. 2025 Jul 22;13:RP93170. doi: 10.7554/eLife.93170. Elife. 2025. PMID: 40694497 Free PMC article.
-
Case report: TP53 and RB1 loss may facilitate the transformation from lung adenocarcinoma to small cell lung cancer by expressing neuroendocrine markers.Front Endocrinol (Lausanne). 2022 Dec 13;13:1006480. doi: 10.3389/fendo.2022.1006480. eCollection 2022. Front Endocrinol (Lausanne). 2022. PMID: 36583000 Free PMC article.
-
Bromodomain Protein-directed Agents and MYC in Small Cell Lung Cancer.Curr Cancer Drug Targets. 2024;24(9):930-940. doi: 10.2174/0115680096272757231211113206. Curr Cancer Drug Targets. 2024. PMID: 38275056 Review.
-
Family matters: How MYC family oncogenes impact small cell lung cancer.Cell Cycle. 2017 Aug 18;16(16):1489-1498. doi: 10.1080/15384101.2017.1339849. Epub 2017 Jul 24. Cell Cycle. 2017. PMID: 28737478 Free PMC article. Review.
Cited by
-
An "-omycs" Toolbox to Work with MYC.Methods Mol Biol. 2021;2318:1-11. doi: 10.1007/978-1-0716-1476-1_1. Methods Mol Biol. 2021. PMID: 34019283
-
Formation of a structurally-stable conformation by the intrinsically disordered MYC:TRRAP complex.PLoS One. 2019 Dec 2;14(12):e0225784. doi: 10.1371/journal.pone.0225784. eCollection 2019. PLoS One. 2019. PMID: 31790487 Free PMC article.
-
Survival analysis with regard to PD-L1 and CD155 expression in human small cell lung cancer and a comparison with associated receptors.Oncol Lett. 2019 Mar;17(3):2960-2968. doi: 10.3892/ol.2019.9910. Epub 2019 Jan 9. Oncol Lett. 2019. PMID: 30854074 Free PMC article.
-
Potential effect of spliceosome inhibition in small cell lung cancer irrespective of the MYC status.PLoS One. 2017 Feb 13;12(2):e0172209. doi: 10.1371/journal.pone.0172209. eCollection 2017. PLoS One. 2017. PMID: 28192473 Free PMC article.
-
Small-cell lung cancer: what we know, what we need to know and the path forward.Nat Rev Cancer. 2017 Dec;17(12):725-737. doi: 10.1038/nrc.2017.87. Epub 2017 Oct 27. Nat Rev Cancer. 2017. PMID: 29077690 Review.
References
-
- Peifer M, Fernández-Cuesta L, Sos ML, George J, Seidel D, Kasper LH, Plenker D, Leenders F, Sun R, Zander T, Menon R, Koker M, Dahmen I, Müller C, et al. Integrative genome analyses identify key somatic driver mutations of small-cell lung cancer. Nat Genet. 2012;44:1104–1110. doi: 10.1038/ng.2396. - DOI - PMC - PubMed
-
- Rudin CM, Durinck S, Stawiski EW, Poirier JT, Modrusan Z, Shames DS, Bergbower EA, Guan Y, Shin J, Guillory J, Rivers CS, Foo CK, Bhatt D, Stinson J, et al. Comprehensive genomic analysis identifies SOX2 as a frequently amplified gene in small-cell lung cancer. Nat Genet. 2012;44:1111–1116. doi: 10.1038/ng.2405. - DOI - PMC - PubMed
-
- Iwakawa R, Takenaka M, Kohno T, Shimada Y, Totoki Y, Shibata T, Tsuta K, Nishikawa R, Noguchi M, Sato-Otsubo A, Ogawa S, Yokota J. Genome-wide identification of genes with amplification and/or fusion in small cell lung cancer. Genes Chromosom Cancer. 2013;52:802–816. doi: 10.1002/gcc.22076. - DOI - PMC - PubMed
-
- Iwakawa R, Kohno T, Totoki Y, Shibata T, Tsuchihara K, Mimaki S, Tsuta K, Narita Y, Nishikawa R, Noguchi M, Harris CC, Robles AI, Yamaguchi R, Imoto S, et al. Expression and clinical significance of genes frequently mutated in small cell lung cancers defined by whole exome/RNA sequencing. Carcinogenesis. 2015;36:616–621. doi: 10.1093/carcin/bgv026. - DOI - PMC - PubMed
MeSH terms
Substances
Grants and funding
LinkOut - more resources
Full Text Sources
Other Literature Sources
Medical
Research Materials
Miscellaneous
