

An inter-species protein-protein interaction network across vast evolutionary distance
- PMID: 27107014
- PMCID: PMC4848758
- DOI: 10.15252/msb.20156484
An inter-species protein-protein interaction network across vast evolutionary distance
Abstract
In cellular systems, biophysical interactions between macromolecules underlie a complex web of functional interactions. How biophysical and functional networks are coordinated, whether all biophysical interactions correspond to functional interactions, and how such biophysical-versus-functional network coordination is shaped by evolutionary forces are all largely unanswered questions. Here, we investigate these questions using an "inter-interactome" approach. We systematically probed the yeast and human proteomes for interactions between proteins from these two species and functionally characterized the resulting inter-interactome network. After a billion years of evolutionary divergence, the yeast and human proteomes are still capable of forming a biophysical network with properties that resemble those of intra-species networks. Although substantially reduced relative to intra-species networks, the levels of functional overlap in the yeast-human inter-interactome network uncover significant remnants of co-functionality widely preserved in the two proteomes beyond human-yeast homologs. Our data support evolutionary selection against biophysical interactions between proteins with little or no co-functionality. Such non-functional interactions, however, represent a reservoir from which nascent functional interactions may arise.
Keywords: Cross‐species complementation; Network evolution; Selection.
© 2016 The Authors. Published under the terms of the CC BY 4.0 license.
Figures
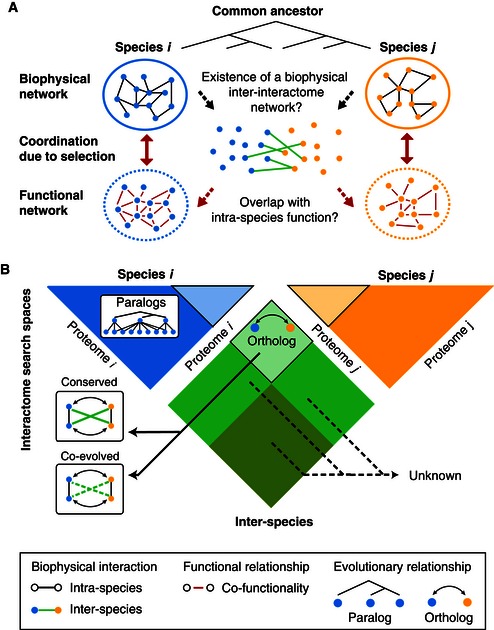
Using inter‐species inter‐interactome networks to investigate how evolution shapes the coordination between biophysical and functional networks.
Proteome‐scale inter‐interactome mapping encompasses large numbers of proteins that are not conserved between the two species and their propensity to form inter‐species interactions unknown.
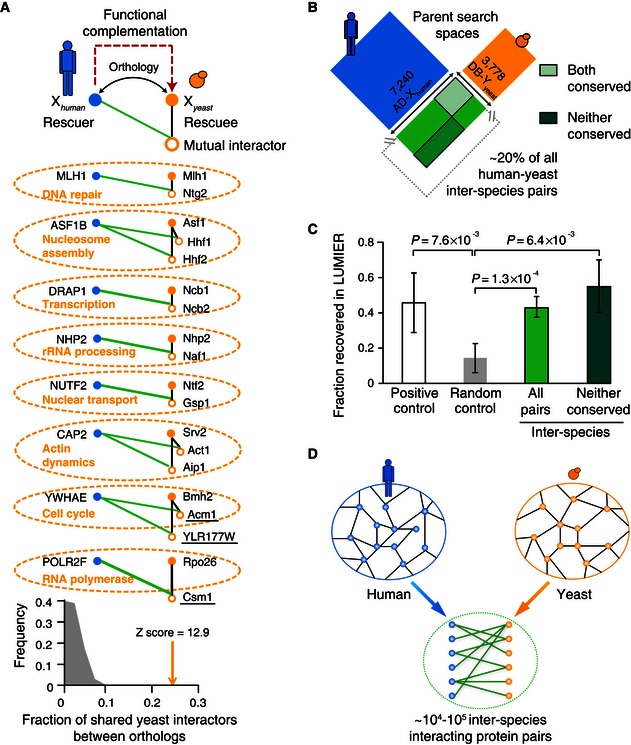
Inter‐species interactions of human rescuers reveal eleven yeast interactors shared by yeast rescuees. Fraction of interactors shared between yeast and human orthologs relative to randomized controls, empirical P‐value = 0.001. Dotted ellipses mark proteins with shared function. Three proteins not conserved from yeast to human are underlined.
Search space of the systematic inter‐species network map matching two parent intra‐species networks.
Fractions of pairs recovered by the orthogonal LUMIER validation assay for: the positive control, the human positive reference set (PRS) (Venkatesan et al, 2009); the random control, the yeast–human random reference set (RRS) (Venkatesan et al, 2009); and inter‐interactome (YHII‐1) sample pairs in the full search space as well as in the subspace containing only proteins not conserved between human and yeast. Error bars: standard error of the proportion. P‐values determined using chi‐square test with Yates correction.
Projected number of inter‐species interactions between the human and yeast proteomes considering the coverage of the YHII‐1 search space and the standard sampling and assay sensitivity using the same Y2H pipeline (Venkatesan et al, 2009).
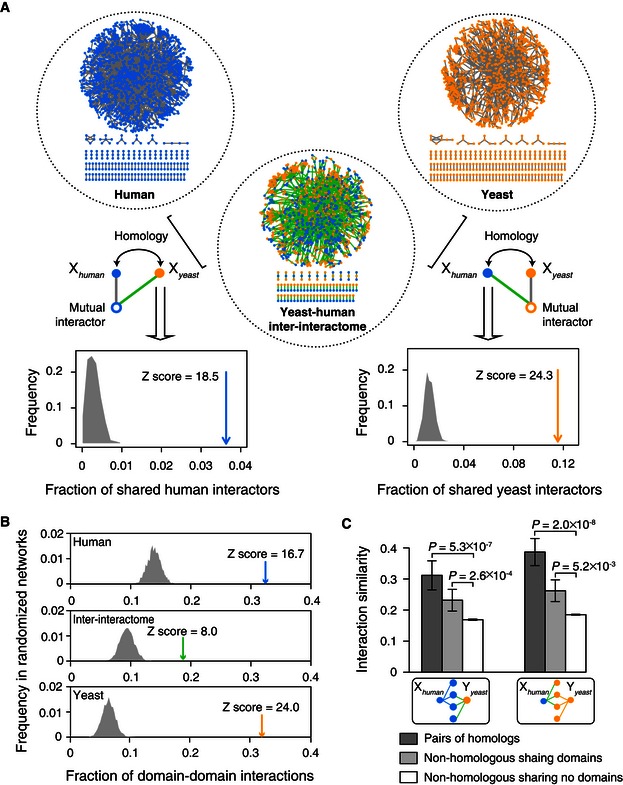
Fractions of shared interactors between human and yeast homolog pairs (arrows) relative to randomized controls (gray‐shaded areas), using intra‐species human HI‐1 (top left) or yeast YI‐1 (top right) as the reference network, empirical P‐values = 0.001. Blue nodes: human proteins; orange nodes: yeast proteins; gray edges: intra‐species yeast–yeast or human–human interactions; green edges: yeast–human inter‐species interactions.
Fractions of interactions plausible through high confidence domain–domain interaction pairs (Yellaboina et al, 2011) in the human (HI‐1, blue arrow), inter‐interactome (YHII‐1, green arrow), and yeast (YI‐1, orange arrow) networks relative to randomized network controls (gray‐shaded areas), empirical P‐value = 0.001.
Interaction profile similarity of human and yeast protein pairs sharing at least one common human (left) or yeast (right) interactor. P‐values determined by Mann–Whitney U‐test.
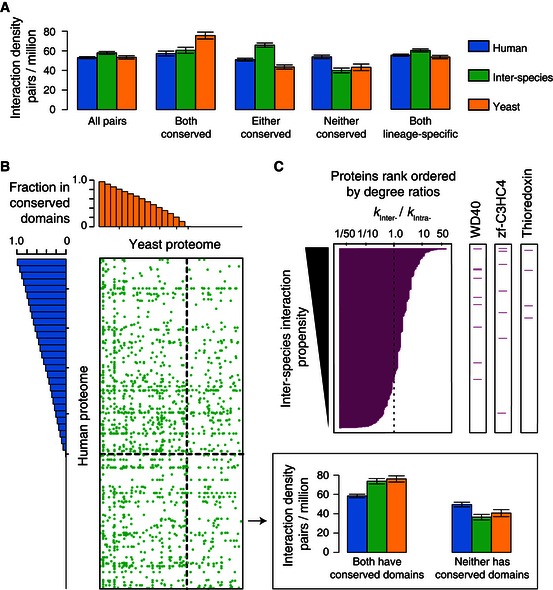
Density of interactions within the full search spaces and the subspaces containing conserved or non‐conserved human and yeast proteins. Error bars: standard error of the proportion.
Proteome‐wide distribution of inter‐species interactions (green dots). Human and yeast proteins are arranged and binned according to the fraction of their sequences found within protein domains present in both yeast and human proteomes. Histograms describe the minimum fractions of sequence in human (left) and yeast (top) proteins within each bin corresponding to protein domains conserved between human and yeast. Dashed line indicates the boundary between proteins with or without protein domains present in both yeast and human proteomes. Inset (top right) shows density of interactions within two subspaces containing proteins with or without conserved domains, respectively.
Domain‐specific interaction propensity measured by the degree ratio (k inter‐/k intra‐) of individual human or yeast proteins containing each protein domain. Proteins rank ordered by the ratio of their inter‐species over intra‐species degrees (left panel, magenta bars). Magenta lines (three right panels) indicate the rank of human or yeast proteins containing the domains (indicated on top) associated with significantly higher inter‐species interaction propensities. Empirical P‐values obtained by comparing to 10,000 randomized network controls for the three domains are: WD40, 0.02; zf‐C3HC4, 0.04; Thioredoxin, 0.02.
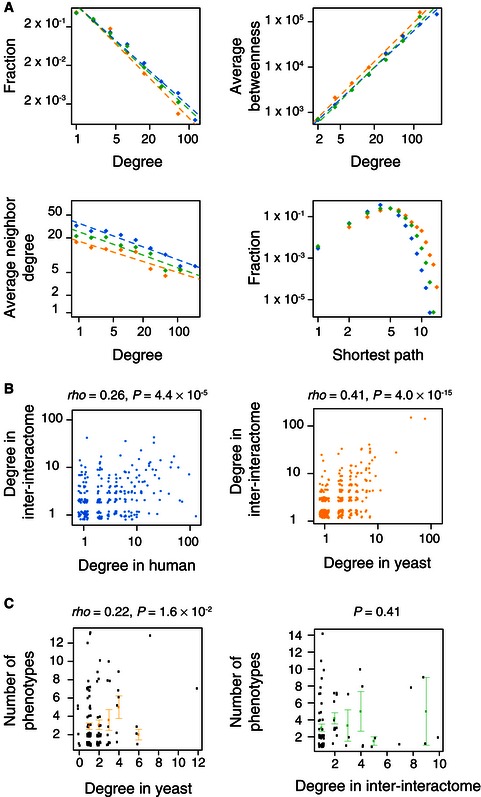
Topological properties for the inter‐interactome (YHII‐1, green dots) compared to the human (HI‐1, blue dots) and yeast (YI‐1, orange dots) networks.
Human (left) and yeast (right) proteins have correlated degrees in the inter‐interactome (YHII‐1) and human (HI‐1) or yeast (YI‐1) networks. Spearman's correlations (rho) are shown.
Numbers of phenotypes associated with deletion of the encoding yeast gene at indicated degree in the yeast (YI‐1, left) and inter‐interactome (YHII‐1, right) data sets. Orange (left) and green (right) dots are averages of black dots at each degree cutoff. Error bars indicate standard error of the proportion. P‐values are for Pearson's correlation test.
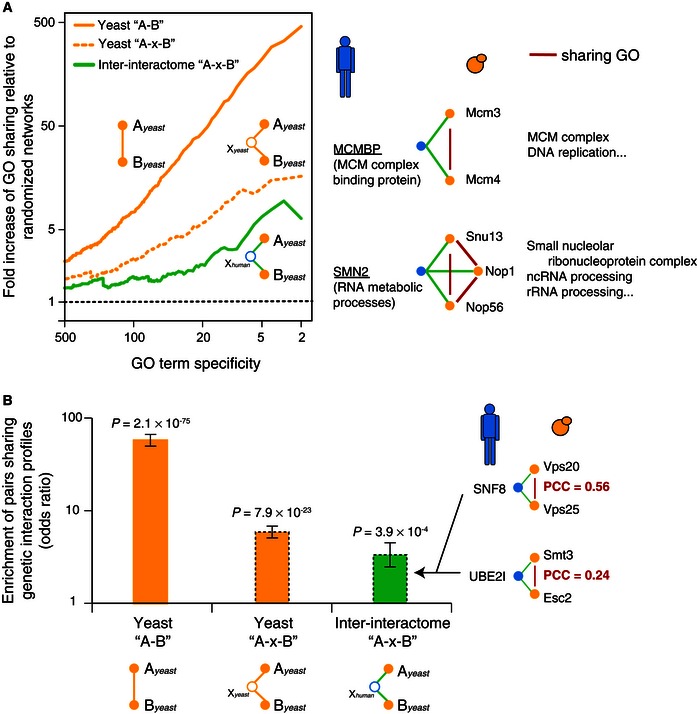
Fold increase of interacting yeast protein pairs sharing specific GO in the inter‐interactome (YHII‐1, green) and intra‐species yeast (YI‐1) networks relative to randomized network controls, at indicated cutoffs of GO specificity (left). Inter‐species example pairs are shown with two non‐conserved human proteins underlined.
Odds ratio enrichments of interacting yeast protein pairs with genetic interaction profile Pearson's correlation coefficients (PCC ≥ 0.2). Error bars indicate standard error. P‐values of enrichment determined by Fisher's exact test. Inter‐species example pairs are shown.
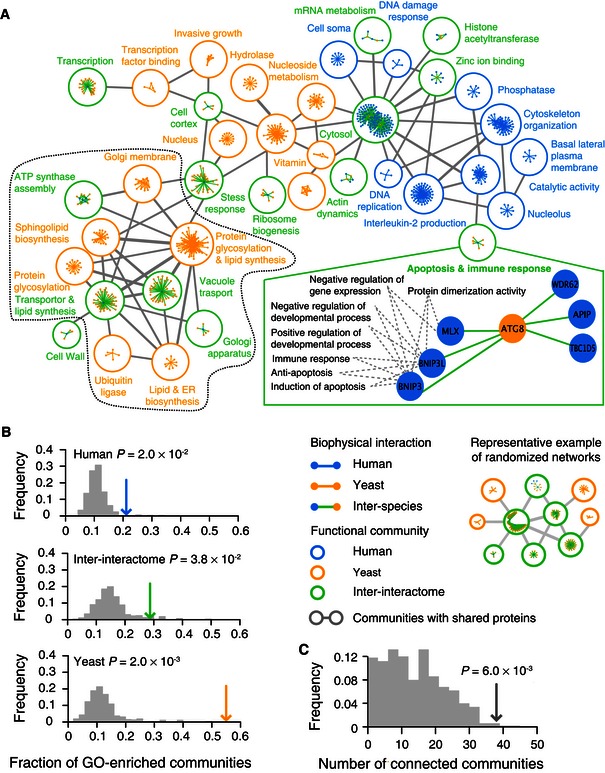
Function‐enriched network communities in the inter‐interactome (YHII‐1) and intra‐species human (HI‐1) and yeast (YI‐1) networks. Communities are connected if they share common protein nodes, with line thickness corresponding to the number of nodes shared between them. Unconnected communities are not shown. Each community is labeled with representative enriched function. A community containing Atg8 is enlarged showing several representative GO annotations enriched in this community. Communities within the dashed black curve (bottom left) are enriched for functions related to protein trafficking.
Fraction of GO‐enriched communities (arrows) in the human (HI‐1), inter‐interactome (YHII‐1), and yeast (YI‐1) networks compared to distributions of randomized network controls (gray histogram). A representative example from randomized networks is shown. Empirical P‐values = 0.002.
The total number of linked communities sharing common proteins from the human (HI‐1), inter‐interactome (YHII‐1), and yeast (YI‐1) networks (gray arrow) compared to distributions of randomized network controls (gray histogram). Empirical P‐value = 0.002.
References
-
- Ahn YY, Bagrow JP, Lehmann S (2010) Link communities reveal multiscale complexity in networks. Nature 466: 761–764 - PubMed
-
- Ashburner M, Ball CA, Blake JA, Botstein D, Butler H, Cherry JM, Davis AP, Dolinski K, Dwight SS, Eppig JT, Harris MA, Hill DP, Issel‐Tarver L, Kasarskis A, Lewis S, Matese JC, Richardson JE, Ringwald M, Rubin GM, Sherlock G (2000) Gene ontology: tool for the unification of biology. The Gene Ontology Consortium. Nat Genet 25: 25–29 - PMC - PubMed
Publication types
MeSH terms
Substances
Grants and funding
LinkOut - more resources
Full Text Sources
Other Literature Sources
Molecular Biology Databases
