. 2017 May;37(5):1641-1655.
doi: 10.1177/0271678X16645113. Epub 2016 Jan 1.

Optogenetic induction of cortical spreading depression in anesthetized and freely behaving mice

Affiliations

Optogenetic induction of cortical spreading depression in anesthetized and freely behaving mice

Thijs Houben et al. J Cereb Blood Flow Metab. 2017 May.

Abstract

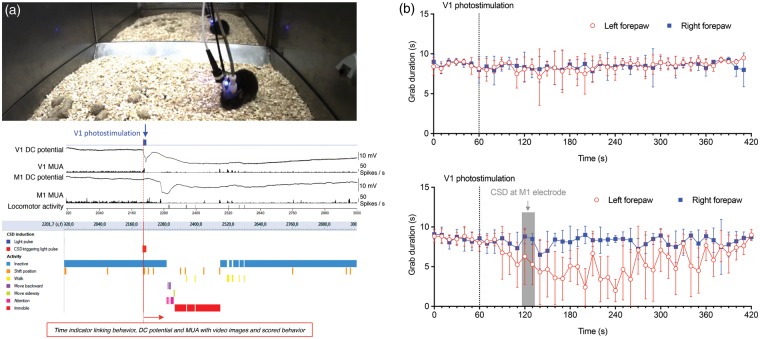
Cortical spreading depression, which plays an important role in multiple neurological disorders, has been studied primarily with experimental models that use highly invasive methods. We developed a relatively non-invasive optogenetic model to induce cortical spreading depression by transcranial stimulation of channelrhodopsin-2 ion channels expressed in cortical layer 5 neurons. Light-evoked cortical spreading depression in anesthetized and freely behaving mice was studied with intracortical DC-potentials, multi-unit activity and/or non-invasive laser Doppler flowmetry, and optical intrinsic signal imaging. In anesthetized mice, cortical spreading depression induction thresholds and propagation rates were similar for invasive (DC-potential) and non-invasive (laser Doppler flowmetry) recording paradigms. Cortical spreading depression-related vascular and parenchymal optical intrinsic signal changes were similar to those evoked with KCl. In freely behaving mice, DC-potential and multi-unit activity recordings combined with laser Doppler flowmetry revealed cortical spreading depression characteristics comparable to those under anesthesia, except for a shorter cortical spreading depression duration. Cortical spreading depression resulted in a short increase followed by prolonged reduction of spontaneous active behavior. Motor function, as assessed by wire grip tests, was transiently and unilaterally suppressed following a cortical spreading depression. Optogenetic cortical spreading depression induction has significant advantages over current models in that multiple cortical spreading depression events can be elicited in a non-invasive and cell type-selective fashion.

Keywords: Behavior; electrophysiology; non-invasive; optogenetics; vascular dynamics.


Figures

Figure 1.
Figure 1.
Characteristics of light-induced CSD in anesthetized Thy1/ChR2-YFP mice. (a) Left panel: method A1 (Supplementary Figure 2(a)) with simultaneous intracortical DC recordings, non-invasive LDF recordings, and non-invasive optogenetic stimulation using an optic fiber, placed on the skull bone above the visual cortex (V1). Right panel: method A2 (Supplementary Figure 2(a)) in which both CSD induction and detection were performed through the intact skull bone. (b) Representative DC-potential shift during light-induced CSD with propagation from the V1 to the M1 cortex in an anesthetized Thy1/ChR2-YFP mouse. *Indicates a sudden drop in extracellular DC-potential during a photostimulation pulse, that was only observed in the V1 DC-potential. (c) Amplitude, duration, and propagation rate of the spreading depolarization wave (see (b)) were determined from intracortical DC-potential recordings (n = 6; method A1). (d) CSD propagation rate determined from the DC recordings or CBF transient recorded from adjacent LDF probes yielded comparable values (n = 6, paired t-test). (e) CSD propagation rate determined from CBF transients were comparable for methods A1 and A2 (n = 6, unpaired t-test). (f) CSD thresholds determined by applying 4-mW 460 nm (blue) light pulses of increasing duration yielded threshold values ranging from 2 to 8 s with comparable range and median for methods A1 and A2 (n = 6, Mann–Whitney U test). (g) Threshold for the second CSD, that was initiated during the second threshold measurement starting 20 min after the first CSD, was higher than for the first CSD in all animals (n = 12, Mann–Whitney U test). (h) Propagation rate for the second CSD was lower than for the first CSD in all animals (n = 12, Wilcoxon signed rank test). (i) CBF in the visual (top traces) and motor cortex (bottom traces) showed a characteristic time course during CSD, consisting of an initial hypoperfusion followed by a transient recovery of CBF and a secondary oligemia (averaged from n = 4 animals, method A2). Left and right panels show CBF during a first and second CSD, respectively. During the second CSD, CBF showed a transient reperfusion.
Figure 2.
Figure 2.
Vascular, electrophysiological, and parenchymal characteristics of light-induced CSD in anesthetized Thy1/ChR2-YFP mice. (a) Characterization of the vascular and parenchymal changes during light-induced CSD was performed in anesthetized mice by optical intrinsic imaging in a thinned skull imaging window over the cortex (method B; Supplementary Figure 2(b)). (b) Top row: unfiltered CCD images through cortical window (thinned skull) montaged over time following CSD elicitation (stimulation site just outside imaging window, top left). Bottom row: same images high-pass filtered, relative to CSD propagation rate, to visualize CSD wave. (c) Left panel: single frame of cortical window with parenchymal and vessel regions of interest (ROI) marked. Middle panel: OIS of parenchymal ROIs normalized to peak. Time to peak response over the cortical window allows one to calculate CSD propagation rate. Right panel: kymographs or “space-time” plots of the changes in blood vessels (dark black region) following CSD. OIS wave propagation is visible in adjacent parenchymal regions (light gray) that brighten as the wave progresses. (d) Top: Representative DC-potential changes of CSDs elicited by photostimulation. Bottom: Summary statistics of CSD amplitude, duration, and velocity.
Figure 3.
Figure 3.
Characteristics of light-induced CSD in freely behaving Thy1/ChR2-YFP mice. (a) For CSD induction and detection in freely behaving mice, optic fibers for stimulation and LDF were placed on the skull bone above the V1 and S1 cortex and intracortical electrodes were placed in the S1 and M1 cortex, connected to a pedestal and fixed to the skull bone using dental cement (method C; Supplementary Figure 1(c)). (b) Representative DC-potential shift during CSD in a freely behaving mouse. (c) Amplitude, duration, and propagation rate of the spreading depolarization wave were determined from intracortical DC recordings (n = 10; Method C). (d) In five animals, we tested the pulse duration required for induction of CSD at multiple light intensities. For each light intensity, pulse duration was increased until CSD was observed. Threshold measurements for individual animals are connected by dotted lines. The gray area indicates combinations of pulse duration and intensity for which no CSD was observed.
Figure 4.
Figure 4.
Relationship between light-induced neuronal MUA and CSD in freely behaving Thy1/ChR2-YFP mice. (a) Combined DC-potential and MUA recordings in the visual (V1) and motor (M1) cortex with S1 LDF during V1 460-nm (blue) light stimulation and CSD. Arrival of the CSD wave front at the intracortical electrodes is characterized by a negative deflection of DC-potential coinciding with a peak of intense neuronal firing (i.e. increased MUA) that is followed by neuronal silencing. CBF in freely behaving mice shows a similar triphasic time course as seen under anesthesia (cf. Figure 1(i)). Following the initial CSD wave, the DC-potential trace shows a prolonged secondary negative DC-shift coinciding with prolonged suppression of MUA and post-CSD oligemia. Inset: Details of MUA, DC-potential, and CBF during the subthreshold light pulse in A, illustrating that photostimulation-evoked neuronal MUA is only observed in the illuminated V1 cortical area, and not in the M1 cortex. (b) In four animals in which a second threshold measurement was performed starting 20 min after the first CSD, a comparable threshold value was found for the second compared to the first CSD (n = 4, Wilcoxon signed rank test). (c) Propagation rate for the second CSD was reduced in all animals compared with the first CSD (n = 4, paired t-test). (d) V1 MUA response during the first photostimulation pulse of the second threshold measurement, calculated as % of MUA response during the last subthreshold pulse of the first threshold measurement. (e) Stable CSD threshold during seven repetitive daily CSD threshold assessments. In five freely behaving Thy1/ChR2-YFP mice, a daily threshold measurement was performed for seven consecutive days. CSD threshold changes for consecutive days never exceeded a single step in pulse duration (steps indicated by horizontal lines) and did not show an overt trend between days one and seven.
Figure 5.
Figure 5.
Changes in electrophysiological network activity and behavior following light-induced CSD in freely behaving Thy1/ChR2-YFP mice. (a) Typical example of changes in M1 electrophysiological network characteristics in relation to CSD. From top to bottom: stimulation light pulses (blue trace); M1 DC-potential (purple trace); time-frequency plot of M1 LFP (LFP 0–45 Hz, power in dB, scale depicted below trace); MUA (black trace); locomotor activity (black vertical lines, automatically detected with a passive infrared motion detection sensor). Note the start of locomotor activity 16 s after the CSD wave reached the M1 location and the increase in delta power during the recovery period following CSD. (b) Averaged vigilance state, power in LFP frequency bands, and the amount of active behavior plotted in 1 min time bins (n = 8 animals; analyzed from the first CSD threshold experiment). Vigilance state analysis shows high levels of non-REM sleep and low levels of REM sleep and locomotor activity during the recovery phase. Analysis of LFP power spectra during the recovery shows an initial suppression in all frequency bands, followed by a fast recovery of delta power. Horizontal lines indicate the mean power before CSD induction. Higher frequency bands recover more slowly at a similar pace as the MUA. The amount of active behavior (as quantified by video analysis) shows a peak in between 1 and 3 min after CSD initiation (n = 8; Dunnett’s multiple comparisons test after significant repeated measures one-way ANOVA), followed by a period of low behavioral activity levels.
Figure 6.
Figure 6.
Effects of light-induced CSD on behavioral activity and cortical function. (a) Still of video (top) and matching electrophysiological V1 and M1 recordings (middle) and ethogram (bottom) showing a representative example of behavior observed before, during, and after CSD induction (see Results section for details). (b) Wire grip test showing equal grip duration for left and right forepaw before and after a subthreshold light pulse over the right V1 cortex, which does not induce CSD (top; P = 0.81, linear regression fit; see Supplementary Figure 4 for test details). Following suprathreshold photostimulation, right forepaw grip duration was not altered (bottom; P = 0.29). In contrast, grip duration of the left (contralateral to the CSD) forepaw was reduced following suprathreshold photostimulation (P < 0.001). The transient reduction is apparent in the data between 30 and 310 s after the suprathreshold photostimulation over the right V1 cortex, the start of which roughly corresponds with the CSD wave reaching the M1 electrode (gray shading indicates the time range in which the CSD wave arrived at the M1 electrode).

References

    1. Lauritzen M, Dreier JP, Fabricius M, et al. Clinical relevance of cortical spreading depression in neurological disorders: migraine, malignant stroke, subarachnoid and intracranial hemorrhage, and traumatic brain injury. J Cereb Blood Flow Metab 2011; 31: 17–35. - PMC - PubMed
    1. Dreier JP, Reiffurth C. The stroke-migraine depolarization continuum. Neuron 2015; 86: 902–922. - PubMed
    1. Pietrobon D, Moskowitz MA. Chaos and commotion in the wake of cortical spreading depression and spreading depolarizations. Nat Rev Neurosci 2014; 15: 379–393. - PubMed
    1. Bolay H, Reuter U, Dunn AK, et al. Intrinsic brain activity triggers trigeminal meningeal afferents in a migraine model. Nat Med 2002; 8: 136–142. - PubMed
    1. Somjen GG. Mechanisms of spreading depression and hypoxic spreading depression-like depolarization. Physiol Rev 2001; 81: 1065–1096. - PubMed