

Patient-specific finite element estimated femur strength as a predictor of the risk of hip fracture: the effect of methodological determinants
- PMID: 27108118
- PMCID: PMC4981620
- DOI: 10.1007/s00198-016-3597-4
Patient-specific finite element estimated femur strength as a predictor of the risk of hip fracture: the effect of methodological determinants
Abstract
A finite element modelling pipeline was adopted to predict femur strength in a retrospective cohort of 100 women. The effects of the imaging protocol and the meshing technique on the ability of the femur strength to classify the fracture and the control groups were analysed.
Introduction: The clinical standard to estimate the risk of osteoporotic hip fracture is based on the areal bone mineral density (aBMD). A few retrospective studies have concluded that finite element (FE)-based femoral strength is a better classifier of fracture and control groups than the aBMD, while others could not find significant differences. We investigated the effect of the imaging protocol and of the FE modelling techniques on the discriminatory power of femoral strength.
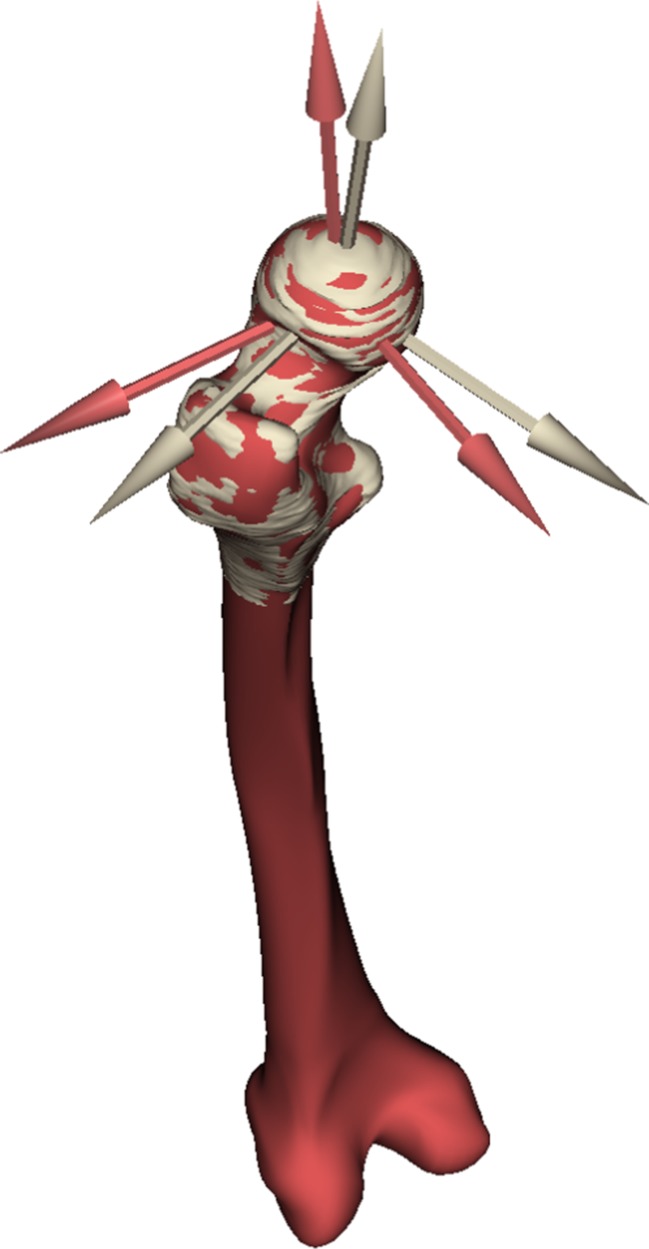
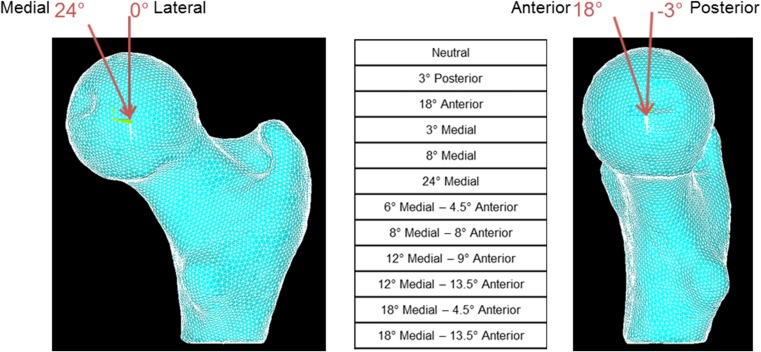
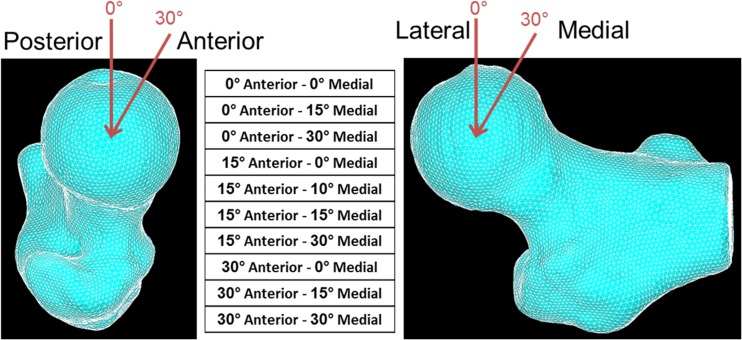
Methods: A retrospective cohort of 100 post-menopausal women (50 with hip fracture, 50 controls) was examined. Each subject received a dual-energy absorptiometry (DXA) exam and a computed tomography (CT) scan of the proximal femur region. Each case was modelled a number of times, using different modelling pipelines, and the results were compared in terms of accuracy in discriminating the fracture and the control cases. The baseline pipeline involved local anatomical orientation and mesh morphing. Revised pipelines involved global anatomical orientation using a full-femur atlas registration and an optimised meshing algorithm. Minimum physiological (MPhyS) and pathological (MPatS) strengths were estimated for each subject. Area under the receiver operating characteristic (ROC) curve (AUC) was calculated to compare the ability of MPhyS, MPatS and aBMD to classify the control and the cases.
Results: Differences in the modelling protocol were found to considerably affect the accuracy of the FE predictors. For the most optimised protocol, logistic regression showed aBMDNeck, MPhyS and MPatS to be significantly associated with the facture status, with AUC of 0.75, 0.75 and 0.79, respectively.
Conclusion: The study emphasized the necessity of modelling the whole femur anatomy to develop a robust FE-based tool for hip fracture risk assessment. FE-strength performed only slightly better than the aBMD in discriminating the fracture and control cases. Differences between the published studies can be explained in terms of differences in the modelling protocol and cohort design.
Keywords: Bone strength; Finite element analysis; Hip fractures; Osteoporosis.
Conflict of interest statement
Conflicts of interest
None.
Data policy statement
The clinical data were collected during a previous research project, funded by the Medical Research Council, UK (grant number G0601272), and the National Institute for Health Research (NIHR), UK. The subject-specific models were generated as part of the VPHOP EU-FP7 project (grant number 223865). In both cases, the data are available only in the frame of collaboration agreements with other research institutions. Please contact the corresponding author for further information on data access policies. The results reported in this paper were generated as part of the MultiSim project (EPSRC Frontier Engineering Awards, Grant Reference No. EP/K03877X/1). The full set of results can be freely downloaded DOI: 10.15131/shef.data.3124108.
Figures
References
-
- Keyak JH, Kaneko TS, Tehranzadeh J, Skinner HB (2005) Predicting proximal femoral strength using structural engineering models. Clin Orthop Relat Res 219-228 - PubMed
MeSH terms
Grants and funding
LinkOut - more resources
Full Text Sources
Other Literature Sources
Medical
