. 2016 Jul;22(7):2370-9.
doi: 10.1111/gcb.13293. Epub 2016 Apr 24.

A replicated climate change field experiment reveals rapid evolutionary response in an ecologically important soil invertebrate

Affiliations

A replicated climate change field experiment reveals rapid evolutionary response in an ecologically important soil invertebrate

Thomas Bataillon et al. Glob Chang Biol. 2016 Jul.

Abstract

Whether species can respond evolutionarily to current climate change is crucial for the persistence of many species. Yet, very few studies have examined genetic responses to climate change in manipulated experiments carried out in natural field conditions. We examined the evolutionary response to climate change in a common annelid worm using a controlled replicated experiment where climatic conditions were manipulated in a natural setting. Analyzing the transcribed genome of 15 local populations, we found that about 12% of the genetic polymorphisms exhibit differences in allele frequencies associated to changes in soil temperature and soil moisture. This shows an evolutionary response to realistic climate change happening over short-time scale, and calls for incorporating evolution into models predicting future response of species to climate change. It also shows that designed climate change experiments coupled with genome sequencing offer great potential to test for the occurrence (or lack) of an evolutionary response.

Keywords: RNA-seq; SNP; field experiment; selection.


Figures

Figure 1
Figure 1
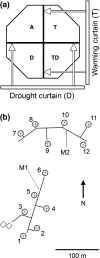
(a) Overview of the experimental manipulation within one octagon (6.8 m width) comprising four slices (hereafter plots). Note that half of the octagons where also submitted to an elevated CO 2 treatment (not shown on the figure). A denotes the ‘Ambient’ (control) condition, while T and D denote, respectively, plots where temperature and drought were manipulated separately (T, D) or jointly (TD). (b) Overview of the design and spatial location of samples listed in Table 1. Octagons 2, 4, 5, 8, 10, and 12 received elevated (CO 2) and are circled in bold. Solid lines show the boardwalks and the locations of the two meteorological stations are marked as M1 and M2. The two rectangles represent buildings that house computers, control systems and field laboratories.
Figure 2
Figure 2
(a) Summary statistics of the transcriptome assembly: genome‐wide distribution of variation in genetic diversity from contig to contig within each pool. For each pool, genetic diversity is measured, within each contig, as the number of variable (SNP) position detected per 1000 nucleotides surveyed. Distributions are reported as smoothed histograms (green: pools sampled in ambient plots, orange: drought; red: drought + temperature + CO 2 plots). Inset graph: (smoothed) empirical distribution of contig length for all contigs (gray), and contigs containing open reading frames (blue). (b) Effect of experimental treatments on two covariates measuring the abiotic environment experienced by the 15 pools used for this study: mean temperature at 5 cm depth and mean soil water content during drought period at 0–20 cm of depth. Each plot is represented by a dot with a color reflecting the type of plot sampled (green: ambient, orange: drought treatment, red: drought + temperature + CO 2).
Figure 3
Figure 3
Testing for micro‐evolutionary response to climatic gradients. Two examples of variation in allele frequency at individual SNPs along an environmental gradient measured through (a) the mean temperature at 5 cm depth or (b) mean soil water content during drought period (0–20 cm depth). Dots indicate actual observed SNP frequencies in ambient (green), drought (orange), and drought + CO 2 + temperature plots (red) and the predicted frequencies (black) using a logistic regression model including the covariate.
Figure 4
Figure 4
Empirical distribution of P‐values for the association of SNPs with (a) the temperature (b) the drought covariate (right). Red line depicts the expected distribution of P‐values under the null hypothesis of no effect of the underlying environmental covariate on SNP frequency. Inset: Venn diagrams describing the amount of overlap between contigs carrying SNPs with significant association in either the 5′UTR, the CDS or the 3′UTR region (counts report the number of contigs in each category).
Figure 5
Figure 5
Distribution of amplitude in the minor allele frequency at SNPs along a gradient defined through either (a) temperature or (b) drought. SNPs with a low associated FDR (q < 0.001) and thus responding to selection are categorized as rejecting the null (HA, in red) while SNPs displaying no association with the environmental gradient when tested (> 0.5) are categorized as stemming from the null distribution (H0, in gray).

References

    1. Andresen LC, Konestabo HS, Maraldo K, Holmstrup M, Ambus P, Beier C, Michelsen A (2011) Organic matter flow in the food web at a temperate heath under multifactorial climate change. Rapid Communications in Mass Spectrometry, 25, 1485–1496. - PubMed
    1. Augustsson AK, Rundgren S (1998) The enchytraeid Cognettia sphagnetorum in risk assessment: advantages and disadvantages. Ambio, 27, 62–69.
    1. Balanyá J, Oller JM, Huey RB, Gilchrist GW, Serra L (2006) Global genetic change tracks global climate warming in Drosophila subobscura . Science, 313, 1773–1775. - PubMed
    1. Bierne N, Roze D, Welch JJ (2013) Pervasive selection or is it…? Why are FST outliers sometimes so frequent? Molecular Ecology, 22, 2061–2064. - PubMed
    1. Bradshaw WE, Holzapfel CM (2001) Genetic shift in photoperiodic response correlated with global warming. Proceedings of the National Academy of Sciences of the USA, 98, 14509–14511. - PMC - PubMed