. 2016 Apr 25:7:11428.
doi: 10.1038/ncomms11428.

A genetic basis for the variation in the vulnerability of cancer to DNA damage

Affiliations

A genetic basis for the variation in the vulnerability of cancer to DNA damage

Brian D Yard et al. Nat Commun. .

Abstract

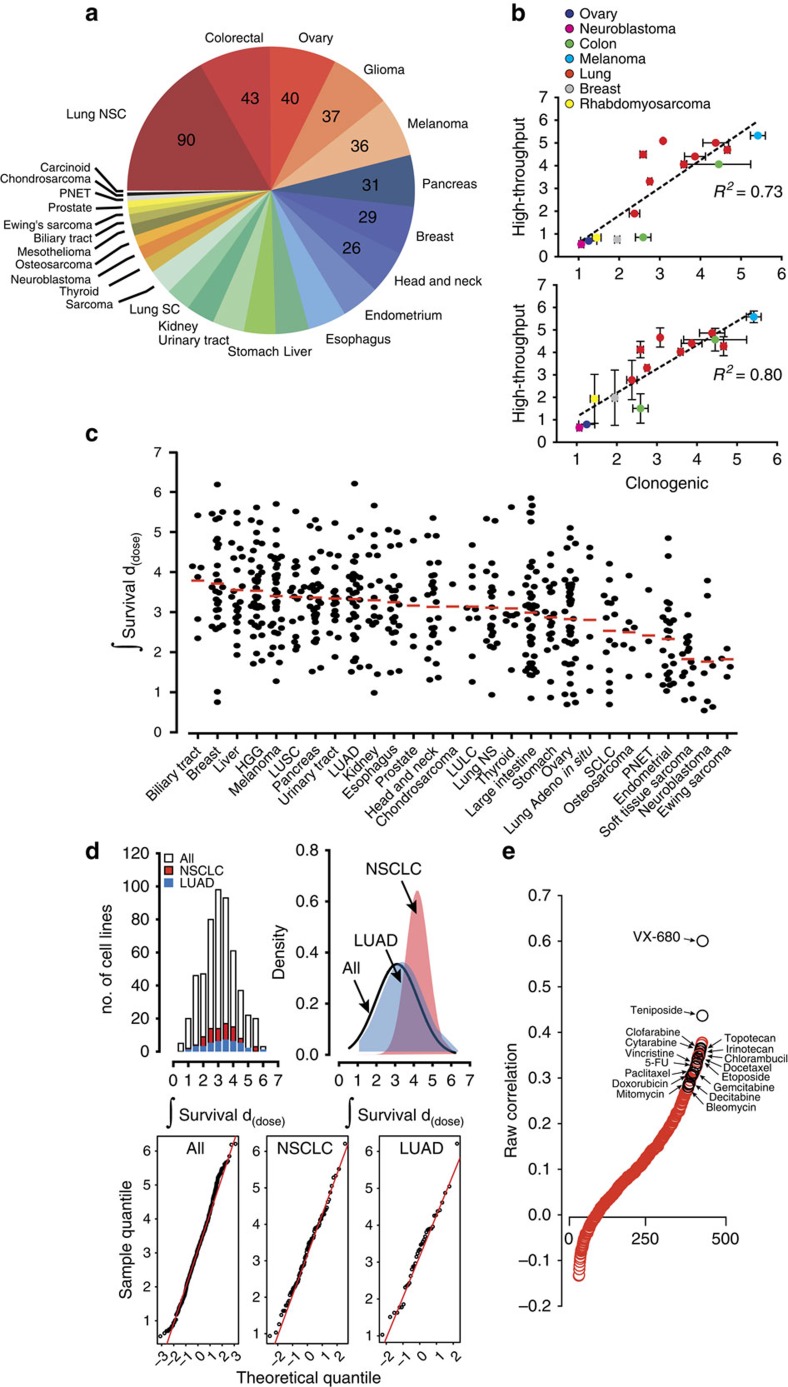
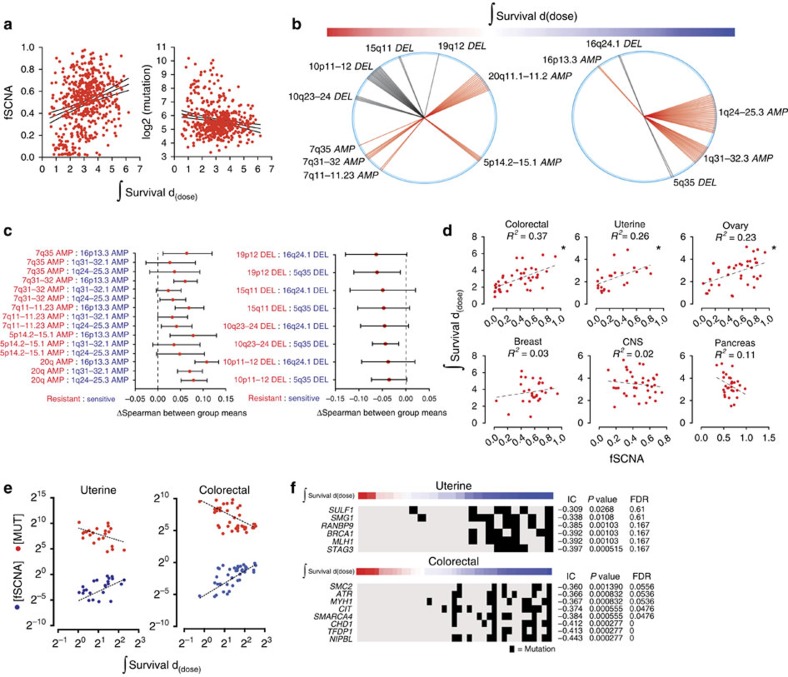
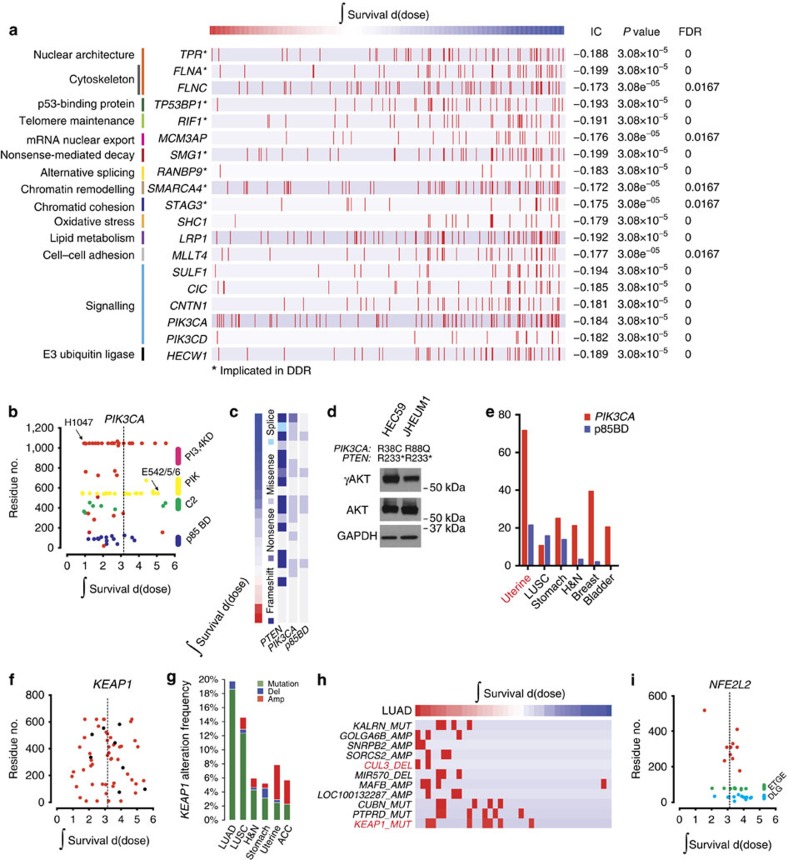
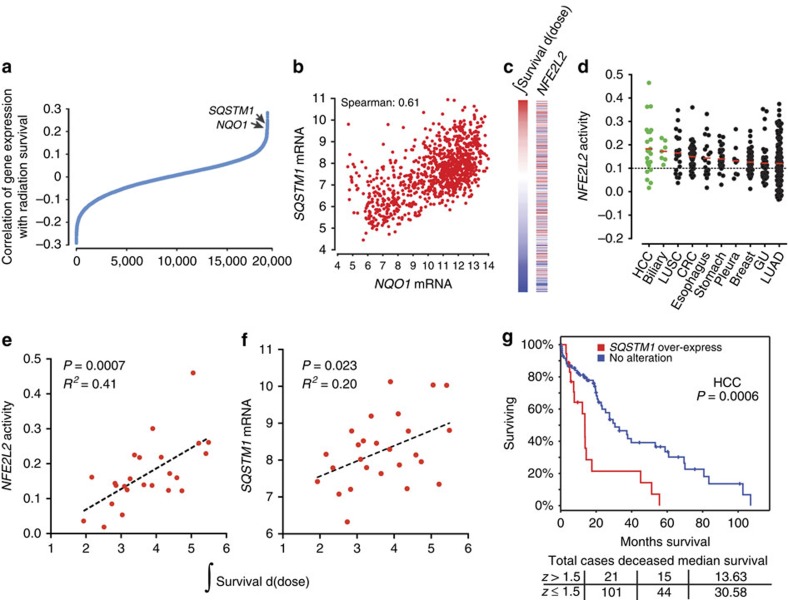
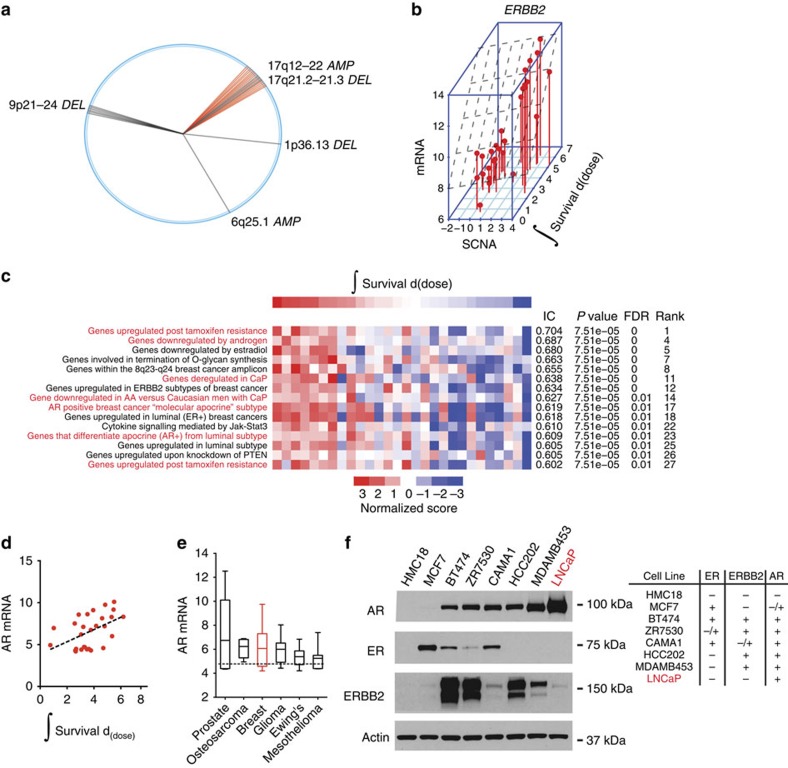
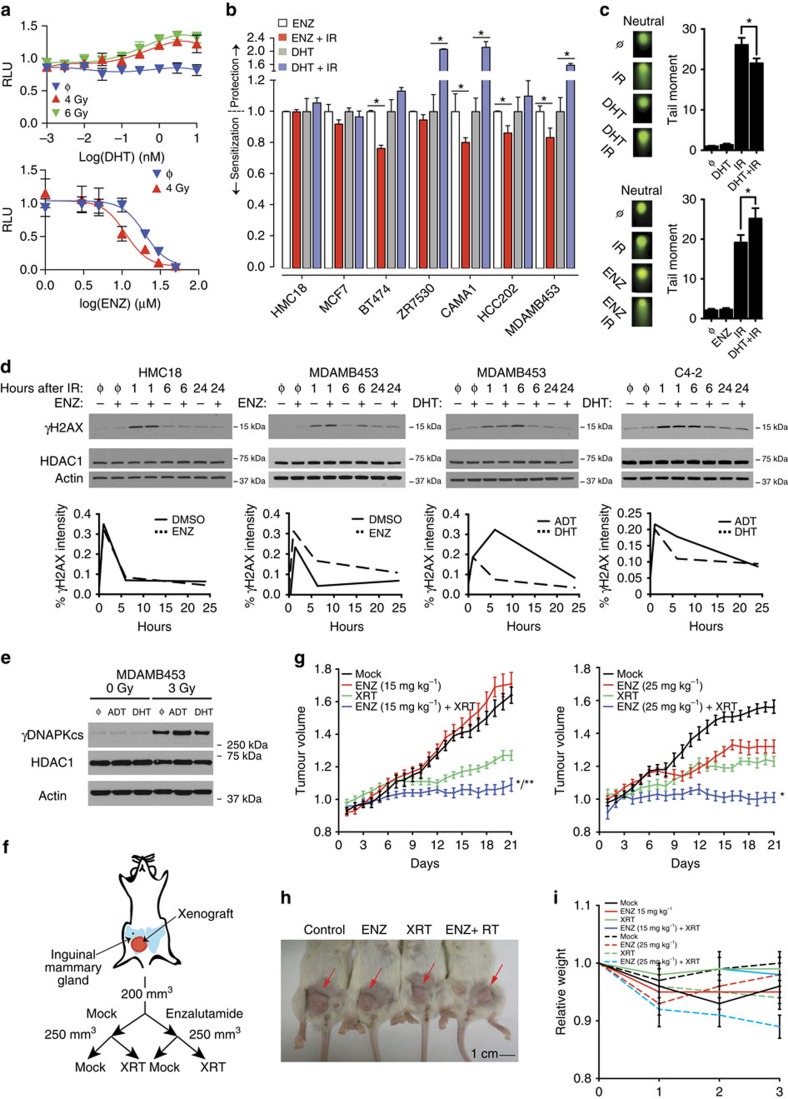
Radiotherapy is not currently informed by the genetic composition of an individual patient's tumour. To identify genetic features regulating survival after DNA damage, here we conduct large-scale profiling of cellular survival after exposure to radiation in a diverse collection of 533 genetically annotated human tumour cell lines. We show that sensitivity to radiation is characterized by significant variation across and within lineages. We combine results from our platform with genomic features to identify parameters that predict radiation sensitivity. We identify somatic copy number alterations, gene mutations and the basal expression of individual genes and gene sets that correlate with the radiation survival, revealing new insights into the genetic basis of tumour cellular response to DNA damage. These results demonstrate the diversity of tumour cellular response to ionizing radiation and establish multiple lines of evidence that new genetic features regulating cellular response after DNA damage can be identified.


Figures

Figure 1
Figure 1. Variation in cancer cell line survival after radiation-induced damage.
(a) Distribution of cancer types profiled by lineage. (b) The high-throughput platform accurately profiles cancer cell lines. Integral survival was calculated for each cell line profiled by the high-throughput platform (n=1 (top), n=2 (bottom)) and by clonogenic survival measurements (n≥2). Scatter plots, linear regression, and R2 values were calculated comparing the integral survivals of the high-throughput platform to clonogenic survival. Data are expressed as the means±s.e.m. (c) Integral survival is displayed by column scatter plot separated by lineage and histology where appropriate. (d) Histogram, probability density function, and Normal Q–Q plots analyses of calculated integral survival of 533 cell lines (‘All'), 89 non-small cell lung cancer cell lines (‘NSCLC'), and 39 lung adenocarcinoma cell lines (‘LUAD'). (e) Correlation of response between radiation and compounds. Spearman correlation coefficient was calculated between integral survival values after exposure to radiation or 481 compounds. Correlation was then plotted relative to correlation rank. Some chemotherapeutic agents in clinical use are shown. HGG, high-grade glioma; LULC, lung large cell; LUSC, lung squamous cancer; PNET, primitive neuroectodermal tumours; SCLC, small cell lung cancer.
Figure 2
Figure 2. SCNA changes are associated with survival after radiation-induced damage.
(a) Plots of fSCNA, integral survival, and number of mutations per sample. (b) The top 50 probes that correlate with radiation resistance (left) and sensitivity (right) are shown. Radii (single probe) or sectors (multiple probes) correspond to chromosome positions. Each radius represents a distinct probe that mapped to the designated chromosome position. (c) Individual SCNA can regulate the response to radiation directly. We correlated radiation survival with the expression of genes within the altered segments and compared the means of the coefficients by pairwise analysis, resistant (red) versus sensitive (blue). Spearman means for alterations depicted in (b) were analysed by analysis of variance and Tukey Contrasts. 95% confidence level intervals for each pairwise comparison are shown. (d) Scatter plots, linear regression, and R2 values of the integral survival and fSCNA by lineage. (e) Scatter plot and linear regression of integral survival, fSCNA, and the number of mutations (MUT) in uterine and colorectal carcinoma. (f) Heatmap of integral survival (red=resistant, blue=sensitive) and gene mutations in uterine and colorectal carcinoma cells. Black bar represents a mutation in the corresponding gene.
Figure 3
Figure 3. Mutations in genes associated with distinct cellular functions correlate with survival after radiation-induced damage.
(a) Top 19 genes that when mutated are associated with radiation sensitivity are organized by biological functions. Red bars represent samples with a mutation. (b) Scatter plot of integral survival and amino acid position for cell lines containing mutations in PIK3CA. (c) Association between radiation response and mutation in PIK3CA and PTEN in uterine carcinoma. (d) γAKT, AKT, and GAPDH levels in two uterine cancer cell lines with p85 BD mutations. (e) Frequency of PIK3CA and PIK3CA p85 BD mutations as annotated by TCGA; organized from left to right by frequency of mutations in p85 BD. (f,i) Scatter plot of integral survival and amino acid position for cell lines containing mutations in KEAP1 and NFE2L2. (g) KEAP1 alteration frequency by lineage, and sub-lineage where appropriate, as annotated by TCGA. Organized from left to right by frequency of KEAP1 mutation. (h) Association between integral survival and genomic features in lung adenocarcinoma. Red bar represents a copy number change or mutation in the corresponding gene.
Figure 4
Figure 4. Gene expression changes regulating oxidative stress response are associated with radiation resistance in several cancer lineages.
(a) Correlation of NQO1 and SQSTM1 expression with radiation resistance. Spearman's correlation coefficient was calculated between gene expression and integral survival values. Correlation was then plotted relative to correlation rank. (b) Relationship between NQO1 and SQSTM1 mRNA expression in CCLE. (c) ssGSEA association between NFE2L2 signature score and integral survival. (d) NFE2L2 is frequently activated in hepatocellular (HCC) and biliary tumours. A column scatter plot of NFE2L2 signature score for 967 cell lines in the CCLE organized by disease site and histology where appropriate. Solid bars represent the mean in each category. Dashed line represents the median across all CCLE lines. (e) NFE2L2 activity scores and (f) SQSTM1 mRNA levels from HCC and biliary cancer cell lines were plotted as a function of radiation integral survival. (g) Kaplan–Meier survival analysis curve calculated from 122 hepatocellular cancer patients from TCGA (https://tcga-data.nci.nih.gov/tcga/); cut-off=z>1.5. z=+0.8 or greater demonstrated a statistically significant difference in overall survival by the log-rank test.
Figure 5
Figure 5. Genes associated with survival after radiation-induced damage in breast carcinoma.
(a) The top 50 copy number probes associated with radiation resistance in breast adenocarcinoma are shown. Radii (single probe) or sectors (multiple probes) correspond to chromosome positions. (b) ERBB2 amplification is associated with survival after radiation-induced damage. Three-dimensional scatter plot of integral survival, ERBB2 copy number, and ERBB2 mRNA expression. (c) ssGSEA identifies gene sets that correlate with resistance to radiation. Heatmap of ssGSEA scores (red=positive, blue=negative). A subset of the top 27 gene sets is shown (see Supplementary Data 10 for MSigDB gene set names). Genes sets depicted in red font are associated with androgen signalling. (d) Scatter plot and linear regression of AR mRNA levels and radiation integral survival in breast cancer. (e) AR is frequently expressed in multiple cancer lineages. A box and whiskers plot of AR expression for 967 cell lines in the CCLE organized by lineage. Whiskers represent minimum and maximum values. (f) (Left) Relative AR, ER, and HER2 protein levels in whole-cell extracts from breast cancer cell lines and LNCaP, a prostate cancer cell line. (Right) Annotation of expression based on western analysis include: −(no observable expression),+(expression) or −/+ (faint expression was observed with longer exposure to film, Supplementary Fig. 7).
Figure 6
Figure 6. AR activity regulates the response to DNA damage in breast carcinoma.
(a) (Top) Cells were cultured in steroid-deprived media −/+ DHT for 24 h and then treated with IR: mock (φ), 4 Gy or 6 Gy. Cells were then supplemented with hormone-proficient media at 48 h post-IR. Cell number was determined on day 14–21. (Bottom) Cells were cultured in hormone-proficient media for 24 h without or with enzalutamide (ENZ) and then treated with IR; mock (φ) or 4 Gy. Error bars represent normalized s.e.m. of at least three experiments. (b) MCF7, BT474, CAMA1, HCC202 and MDAMB453 cells were treated with ENZ, ENZ+IR, DHT or DHT+IR as in a. HMC18 cells were treated similarly but were profiled by clonogenic survival assays. Error bars represent normalized s.e.m. of at least three experiments and the Student's t-test was used for statistical analysis. *P<0.05. (c) Neutral Comet assay of MDAMB453 cell line, showing increased double-strand breaks when cells were irradiated in steroid-deprived conditions (left) or after 24 h of treatment with 20 μM of ENZ (right). Error bars represent s.e.m. of at least three experiments and the Student's t-test was used for statistical analysis. *P<0.05. (d) Cells were cultured in hormone-proficient (FBS) media for 24 h −/+ ENZ and then treated with IR: mock (φ), 3 Gy (HMC18 and MDAMB453), or 2 Gy (C4–2). Cells were cultured in steroid-deprived media for 48 h, treated −/+ DHT for 24 h, and then treated with IR: mock (φ), 3 Gy (HMC18 and MDAMB453), or 2 Gy (C4–2). γH2AX, HDAC1, and actin levels were measured at the indicated time points. Relative intensity of γH2AX was calculated by ImageJ64. (e) MDAMB453 cells were cultured in steroid-replete, steroid-deficient, or steroid-deficient with 1 nM DHT for 24 h, then treated with irradiation. Cells were harvested and expression of γDNAPKcs was analysed. Androgen deprivation therapy (ADT). (f) Schematic of treatment arms. (g) MDAMB453 cells were orthotopically injected into the mammary gland of NSG mice and block randomized into one of four treatment arms as shown. Tumour volume was measured daily. Error bars represent normalized s.e.m. of at least seven mice in each treatment arm. *P<0.05 compared with all other treatment conditions based on analysis of variance (ANOVA) and Tukey Contrasts. **P<0.05 for interaction based on two-way ANOVA. (h) Pictorial depiction of representative mice from each arm of cohort 2 at the end of treatment. This cohort received ENZ at 25 mg kg−1. (i) Average weight for each arm in both cohorts was measured weekly. Data are expressed as the means±s.e. of at least seven mice in each treatment arm.

References

    1. Alhassani A., Chandra A. & Chernew M. E. The sources of the SGR ‘hole'. N. Engl. J. Med. 366, 289–291 (2012). - PubMed
    1. Ree A. H. & Redalen K. R. Personalized radiotherapy: concepts, biomarkers and trial design. Br. J. Radiol. 88, 20150009 (2015). - PMC - PubMed
    1. Yard B., Chie E. K., Adams D. J., Peacock C. & Abazeed M. E. Radiotherapy in the era of precision medicine. Semin. Radiat. Oncol. 25, 227–236 (2015). - PubMed
    1. Chapman P. B. et al.. Improved survival with vemurafenib in melanoma with BRAF V600E mutation. N. Engl. J. Med. 364, 2507–2516 (2011). - PMC - PubMed
    1. Lynch T. J. et al.. Activating mutations in the epidermal growth factor receptor underlying responsiveness of non-small-cell lung cancer to gefitinib. N. Engl. J. Med. 350, 2129–2139 (2004). - PubMed

Publication types

MeSH terms