. 2016 Apr 25:7:11373.
doi: 10.1038/ncomms11373.

Mechanical cell competition kills cells via induction of lethal p53 levels

Affiliations

Mechanical cell competition kills cells via induction of lethal p53 levels

Laura Wagstaff et al. Nat Commun. .

Abstract

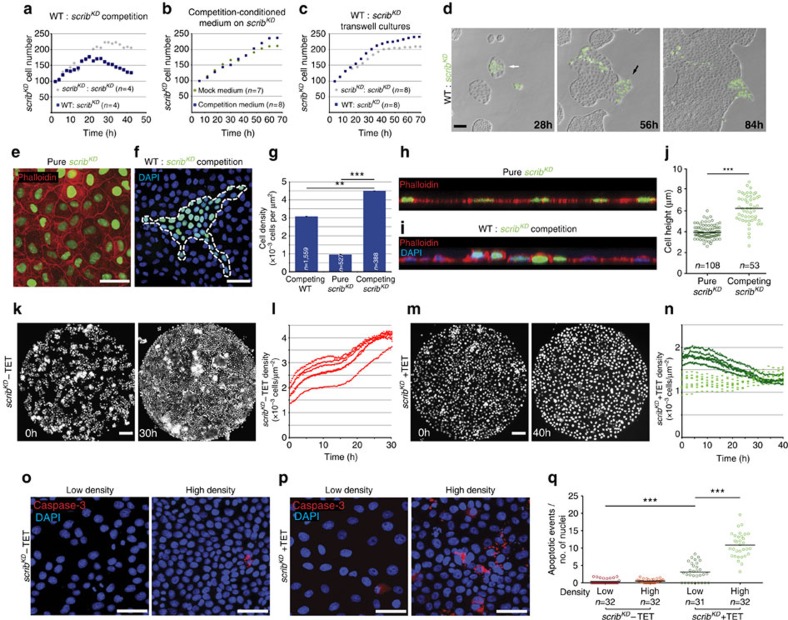
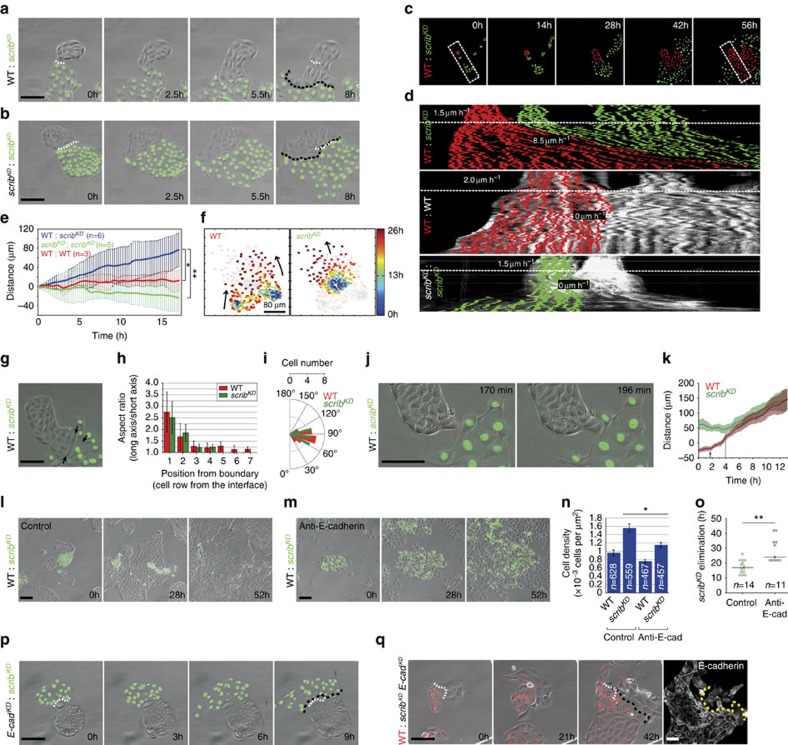
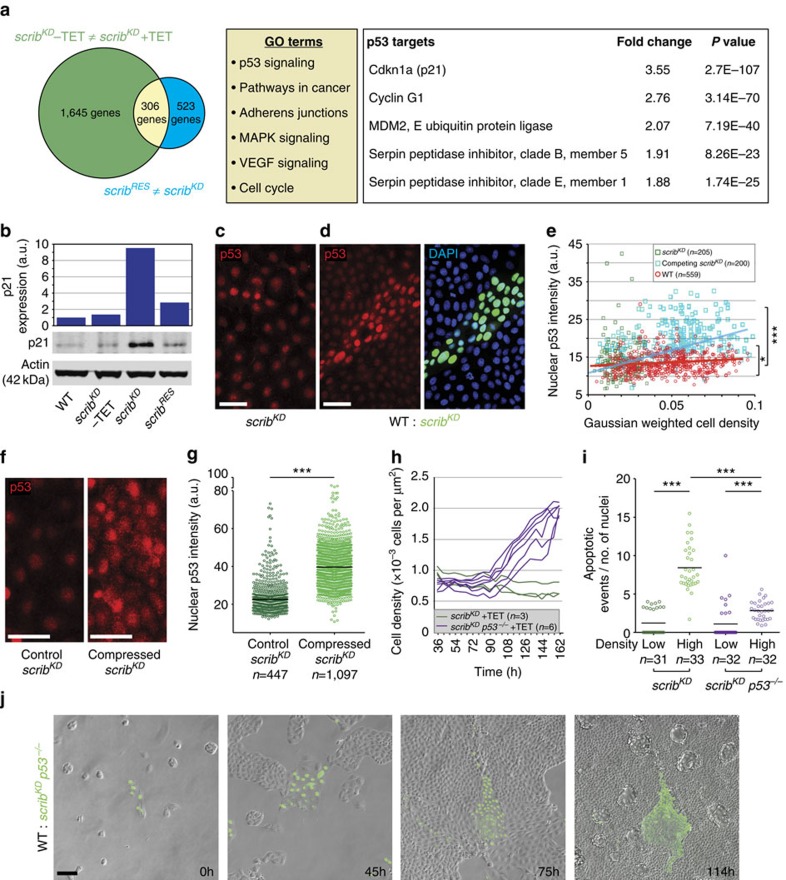
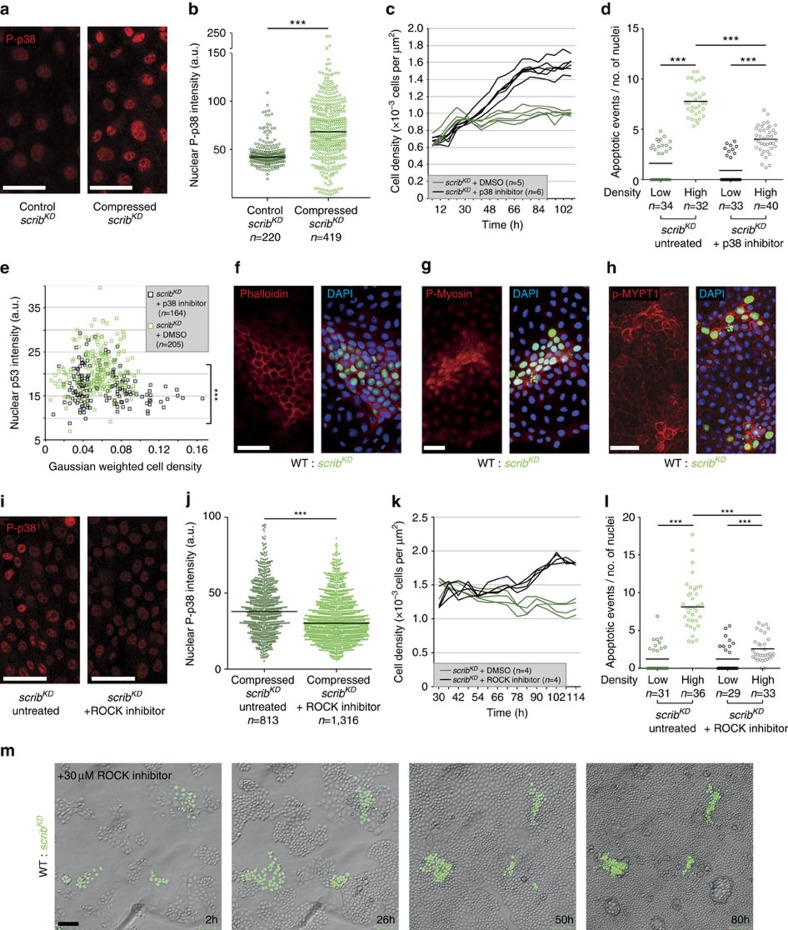
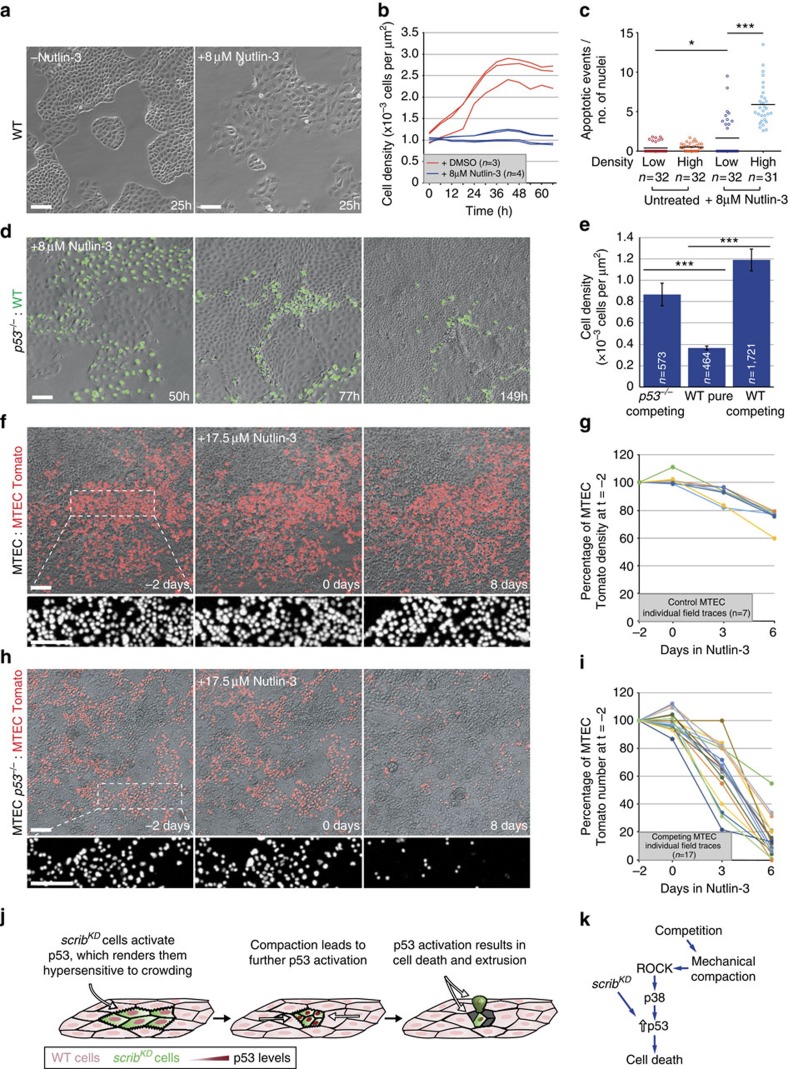
Cell competition is a quality control mechanism that eliminates unfit cells. How cells compete is poorly understood, but it is generally accepted that molecular exchange between cells signals elimination of unfit cells. Here we report an orthogonal mechanism of cell competition, whereby cells compete through mechanical insults. We show that MDCK cells silenced for the polarity gene scribble (scrib(KD)) are hypersensitive to compaction, that interaction with wild-type cells causes their compaction and that crowding is sufficient for scrib(KD) cell elimination. Importantly, we show that elevation of the tumour suppressor p53 is necessary and sufficient for crowding hypersensitivity. Compaction, via activation of Rho-associated kinase (ROCK) and the stress kinase p38, leads to further p53 elevation, causing cell death. Thus, in addition to molecules, cells use mechanical means to compete. Given the involvement of p53, compaction hypersensitivity may be widespread among damaged cells and offers an additional route to eliminate unfit cells.


Figures

Figure 1
Figure 1. Compaction of scribKD cells is both required and sufficient for their elimination.
(ac) Quantification showing growth rate of scribKD cells from time-lapse movies of: competition versus pure cultures (a), pure cultures in mock conditioned versus competition conditioned medium; two biological replicates (b) or transwell experiments, where scribKD cells were co-cultured across transwells with control or with competing cultures; three biological replicates (c). Each dot represents the average of n fields of cells. See also Supplementary Fig. 1c. (d) Time course of cell competition assay between unlabelled wild-type (WT) and GFP-labelled scribKD MDCK cells. Competition is observed in surrounded scribKD cells (white arrow), but not in cells that are only contacted (black arrow), see corresponding Supplementary Movie 2. (e) Confluent GFP-labelled scribKDcells stained with phalloidin. (f) Competing unlabelled WT and GFP-labelled scribKD cells counterstained with DAPI. (g) Quantification showing average (±s.e.m.) cell density values of confluent pure scribKD cells and subconfluent competing WT and scribKDcells as in e and f. (h,i) Confocal xz sections of representative GFP-labelled scribKDcells pure (h) or co-cultured with WT cells (i), stained with phalloidin (h,i) and DAPI (i). (j) Quantifications of cell height from images as in h and i. Black bars=median. (k,m) Representative stills from time lapse of GFP-labelled scribKD cells +/−TET growing on micropatterns (800 μm Ø), see corresponding Supplementary Movie 3. (l,n) Quantifications of cell density over time from movies as in k and m. Each dotted line corresponds to a different movie. (o,p) Cleaved Caspase-3 staining in WT (o) and scribKD (p) cells +/− compression (high density and low density, respectively). (q) Quantification of cell death events (cleaved Caspase-3) from images as in o and p. Data are pooled from three biological replicates. Black bars=mean; three biological replicates across two independent experiments. n=number of fields imaged in a single repeat (ac,q) or n=number of cells (g,j). Scale bars, 100 μm (movie sequences) and 50 μm (immunofluorescence images) here and throughout all figures. **P<0.005, ***P<0.0005 by KS test.
Figure 2
Figure 2. Contact-induced migration promotes compaction and cell competition.
(a,b) Stills from movies of wild-type (WT) and GFP-labelled scribKD co-cultures (a) or scribKD homotypic cultures (b), see Supplementary Movie 4,5. (c,d) Kymographs (d) from movies as in c. Velocities are shown before (above dashed white line) and after contact (below line). (e) Plot showing displacement of the line of contact between clones from movies as in c. The continuous line is the position of the front average±s.d.; n=number of contact lines averaged. (f) Single-cell tracking of trajectories of WT and scribKD cells during competition. Heat-map representation shows time-resolved position of single cells. (g) Micrograph exemplifying cell shape change (arrows) after contact between WT and scribKD cells. (h) Bar plot representing aspect ratio of WT and scribKD cells as a function of distance from their contact point. n=50 cells of each type from three movies; error bars=s.d. (i) Distribution of angles between a cell's long axis and its direction of motion; n (WT)=18 cells; n (scribKD)=17 cells. (j,k) PIV analysis of images at time of contact (see Supplementary Movie 6) (j); and quantification of cell displacements (k) shows WT cells begin migrating (arrows) before scribKD cells; n=10 cells for each type from three independent movies. Coloured lines=mean; shaded areas=s.d. (lo) Disrupting cell junctions by E-cadherin blocking antibody and calcium removal prevents contact-induced migration (m), compaction (n) and delays competition (o) compared with control (l), see Supplementary Movie 8; error bars=s.e.m. (p) E-cadherin knockdown in WT cells (E-cadKD) prevents contact-induced migration. (q) E-cadherin knockdown in scribKD cells (scribKD E-cadKD) prevents contact-induced migration, see Supplementary Movie 9. Right panel displays anti-E-cadherin immunofluorescence at end of movie (see Supplementary Fig. 2h,i). Five independent repeats; n=10 events showing absence of directional migration, five were validated for E-cadherin levels and all five had WT levels. White dashed line=initial contact point; black dashed line=final contact point; yellow dashed line separates WT from scribKD E-cadKD cells. *P<0.05, **P<0.005 by KS test.
Figure 3
Figure 3. p53 is activated in scribKD cells before competition and further p53 elevation upon compaction causes competition-induced cell death.
(a) Left, transcriptional profiling of scribKD cells without tetracycline (TET) versus scribKD cells with TET (green) and of scribKD cells with TET versus scribKD cells resistant to competition (scribRES) with TET (blue), and corresponding intersection of differentially expressed genes (yellow). Middle, list of pathways functionally enriched in the yellow intersection. Right, list of p53 targets found in this intersection and corresponding fold change difference between scribKD cells −/+TET. Three biological replicates for scribKD cells −/+TET and two biological replicates for scribRES cells +TET. (b) Western blot against p21 with LICOR quantifications and normalization to Actin. (c,d) p53 staining of pure scribKD cells (c) and of co-cultures of GFP-labelled scribKD and wild-type (WT) cells (d). (e) Graph showing single-cell nuclear p53 intensity plotted against cell density from images as in c and d; *P<0.05 by KS test comparing p53 levels in pure scribKD versus WT; ***P<0.0005 by KS test comparing competing scribKD versus WT. Non-parametric Spearman correlation; red line=WT cells; blue line=competing scribKD cells. (f,g) p53 staining in pure scribKD cells on PDMS substrate +/− compression (f) and quantification showing single-cell nuclear p53 intensity (g) from images as in f; black bars=median. (h) Time-resolved density measurement of growing scribKD cells and scribKD p53−/− cells. (i) Quantification of cell death (cleaved Caspase-3) for scribKD cells versus scribKD p53−/− cells on PDMS substrate +/− compression; black bars=mean; data from three biological replicates across two independent experiments. (j) Stills from time-lapse movies of WT and GFP-labelled scribKD p53−/− co-cultures, see corresponding Supplementary Movie 11; n=cell number in e and g or n=number of imaged fields of cells in h and i. a.u.=arbitrary units, here and throughout all the figures. *P<0.05, ***P<0.0005 by KS test.
Figure 4
Figure 4. During mechanical cell competition ROCK activates p38 leading to p53 elevation.
(a) Phosphorylated p38 (P-p38) staining in pure scribKD cells +/− compression. (b) Single-cell nuclear P-p38 intensity from images as in a; black bars=median. (c) Time-resolved density measurement of growing scribKD cells +/− p38 inhibitor. (d) Quantification of cell death (cleaved Caspase-3) of scribKD cells with or without compression and +/− p38 inhibitor; black bars=mean; pooled data from three biological replicates across two independent experiments. (e) Single-cell nuclear p53 signal intensity in competing scribKD cells +/− p38 inhibitor, plotted against cell density. (fh) F-Actin (phalloidin-stained, f), phosphorylated Myosin-II (P-Myosin, g) and phosphorylated MYPT1 (p-MYPT1, h) are elevated in compacted GFP-labelled scribKD cells compared with wild-type (WT) cells during competition. (i) P-p38 staining in compressed scribKD cells +/− ROCK inhibitor. (j) Single-cell nuclear P-p38 intensity from images as in i; black bars=median. (k) Time-resolved density measurement of growing scribKD cells +/− ROCK inhibitor; two independent repeats. (l) Quantification of cell death (cleaved Caspase-3) in scribKD cells with or without compression and +/− ROCK inhibitor; black bars=mean; pooled data from three biological replicates across two independent experiments. (m) Stills from time-lapse movies of WT and GFP-labelled scribKD co-cultures treated with ROCK inhibitor (30 μM), see corresponding Supplementary Movie 12; n=cell number in b,e and j or n=number of imaged fields of cells in c,d,k and l. ***P<0.0005 by KS test.
Figure 5
Figure 5. p53 activation is sufficient to induce crowding hypersensitivity and mechanical cell competition.
(a) Addition of Nutlin-3 (8 μM) causes flattening of wild-type (WT) MDCK cells; n=4 fields per repeat. (b) Time-resolved cell density measurement of growing WT MDCK cells +/− Nutlin-3 (8 μM). (c) Quantification of cell death (cleaved Caspase-3) of WT MDCK cells with and without compression and +/− Nutlin-3 (8 μM); black bars=mean; three biological replicates from two independent experiments. (d) Stills from time-lapse movies of WT and p53−/− MDCK co-cultures with Nutlin-3 (8 μM) see corresponding Supplementary Movie 13. (e) Cell density measurement from movies as in d; mean±s.e.m. (f) Stills from time-lapse movies of primary cultures of unlabelled and Tomato-labelled WT MTECs (see corresponding Supplementary Movie 14). Nutlin-3 (17.5 μM) was added at t=0. (g) Time-resolved cell density measurement from movies as in f of WT MTECs before and after Nutlin-3 (17.5 μM) addition. (h) Stills from time-lapse movies of primary cultures of unlabelled p53−/− and Tomato-labelled WT MTECs (see corresponding Supplementary Movie 15). Nutlin-3 (17.5 μM) was added at t=0. (i) Time-resolved measurement of cell number from movies as in h of WT MTECs before and after Nutlin-3 (17.5 μM) addition. (j,k) Model of mechanical cell competition of scribKD cells; n=cell number in e or n=number of imaged fields of cells in b,c,g and i. For c and e, data are pooled from three biological replicates. *P<0.05, ***P<0.0005 by KS test.

References

    1. Morata G. & Ripoll P. Minutes: mutants of drosophila autonomously affecting cell division rate. Dev. Biol. 42, 211–221 (1975). - PubMed
    1. Moreno E. & Basler K. dMyc transforms cells into super-competitors. Cell 117, 117–129 (2004). - PubMed
    1. la Cova, de C., Abril M., Bellosta P., Gallant P. & Johnston L. A. Drosophila myc regulates organ size by inducing cell competition. Cell 117, 107–116 (2004). - PubMed
    1. Oertel M., Menthena A., Dabeva M. D. & Shafritz D. A. Cell competition leads to a high level of normal liver reconstitution by transplanted fetal liver stem/progenitor cells. Gastroenterology 130, 507–520 (2006). - PubMed
    1. Rhiner C. et al.. Persistent competition among stem cells and their daughters in the Drosophila ovary germline niche. Development 136, 995–1006 (2009). - PubMed

Publication types

MeSH terms