. 2016 Apr 25:6:24751.
doi: 10.1038/srep24751.

Biofluorescence in Catsharks (Scyliorhinidae): Fundamental Description and Relevance for Elasmobranch Visual Ecology

Affiliations

Biofluorescence in Catsharks (Scyliorhinidae): Fundamental Description and Relevance for Elasmobranch Visual Ecology

David F Gruber et al. Sci Rep. .

Abstract

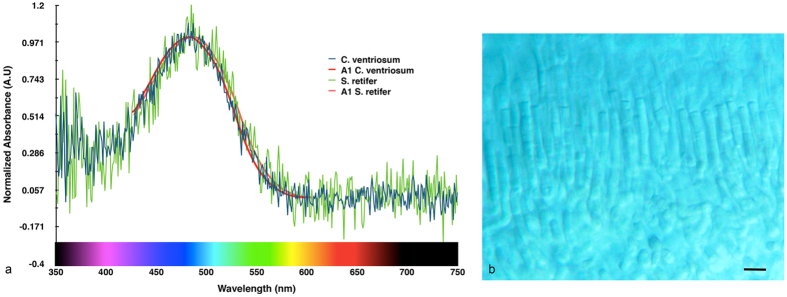
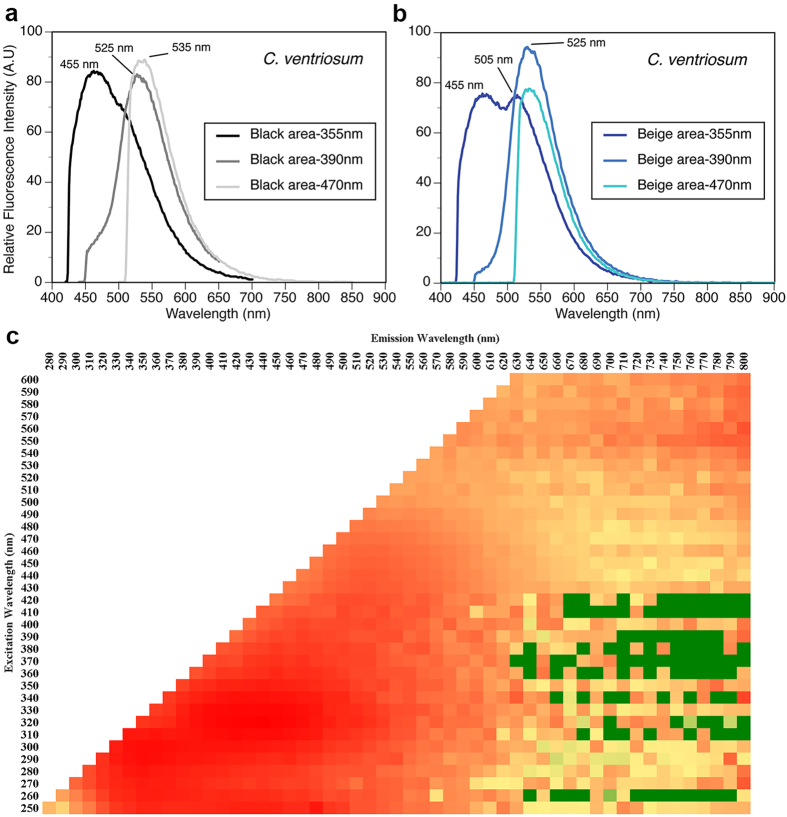
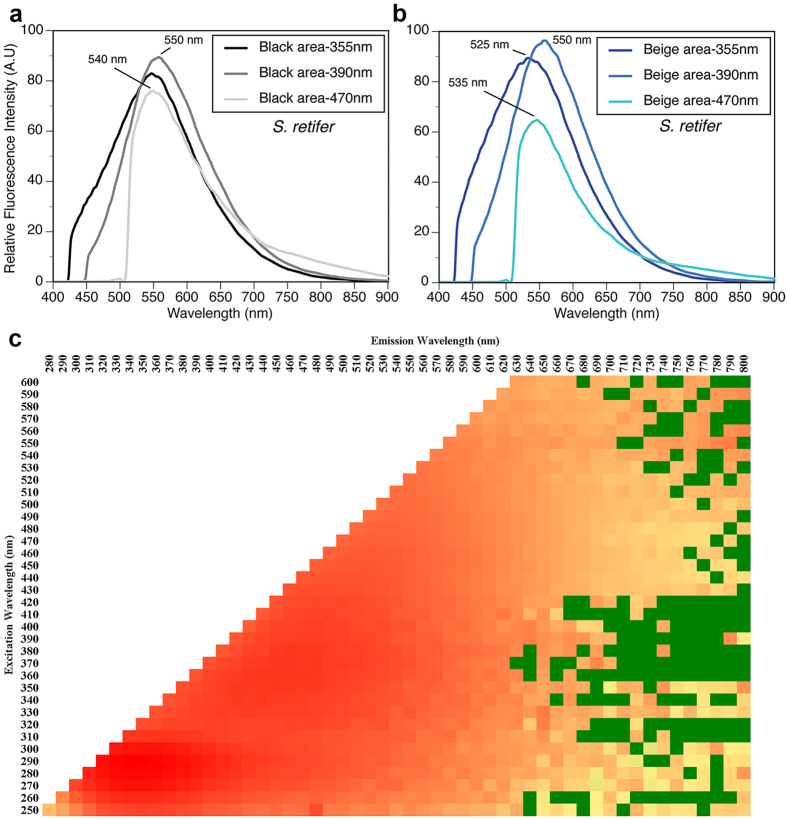
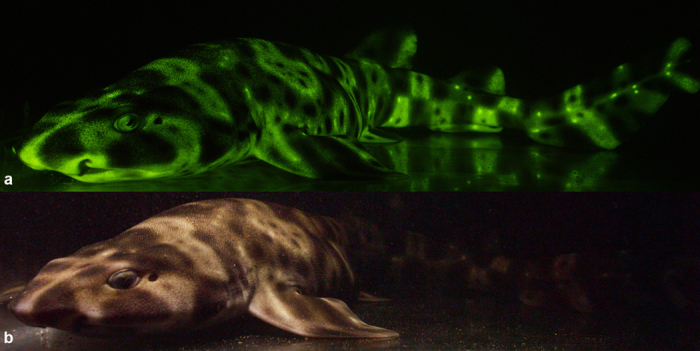
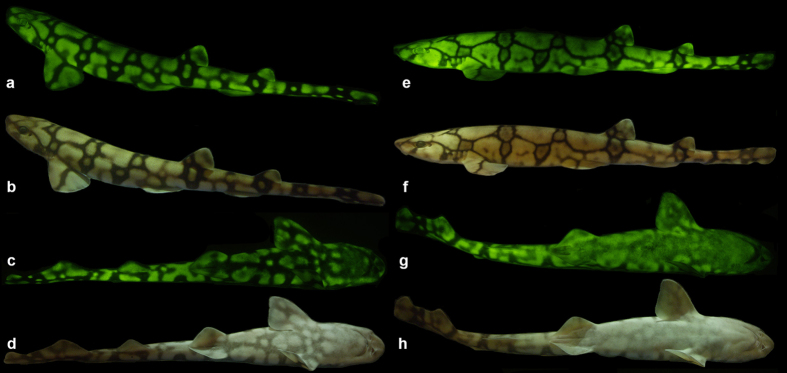
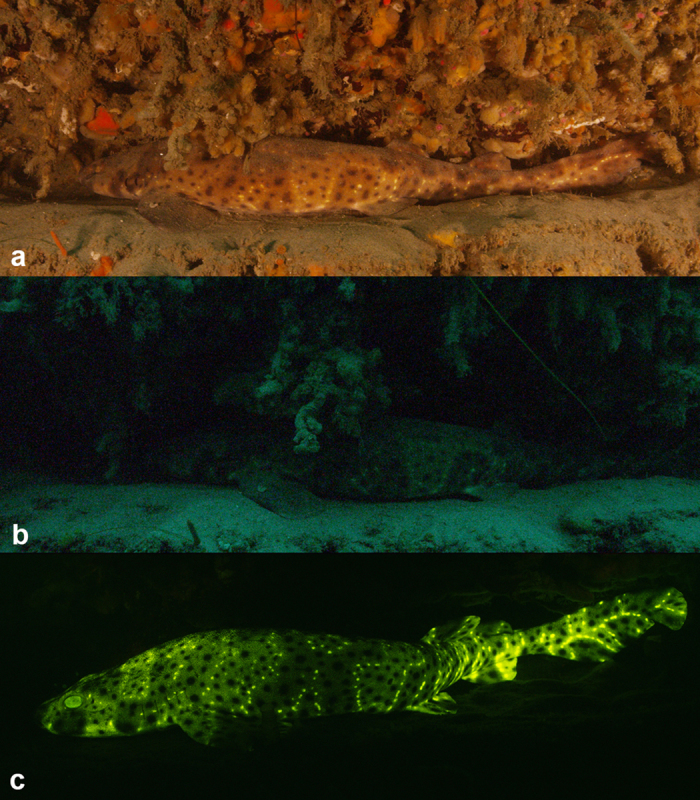
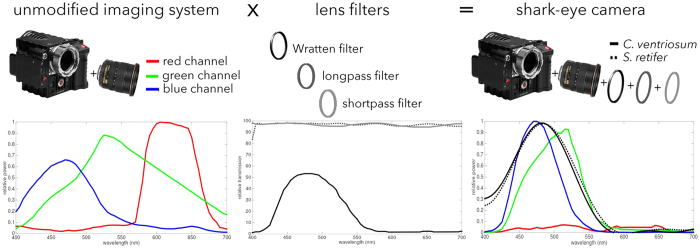
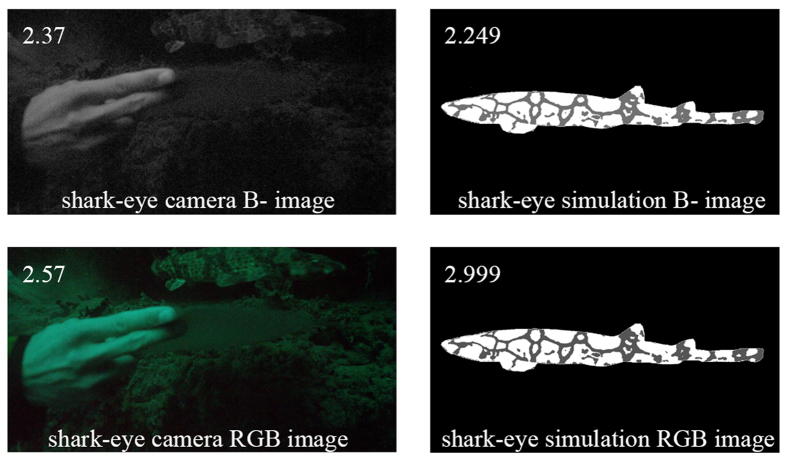
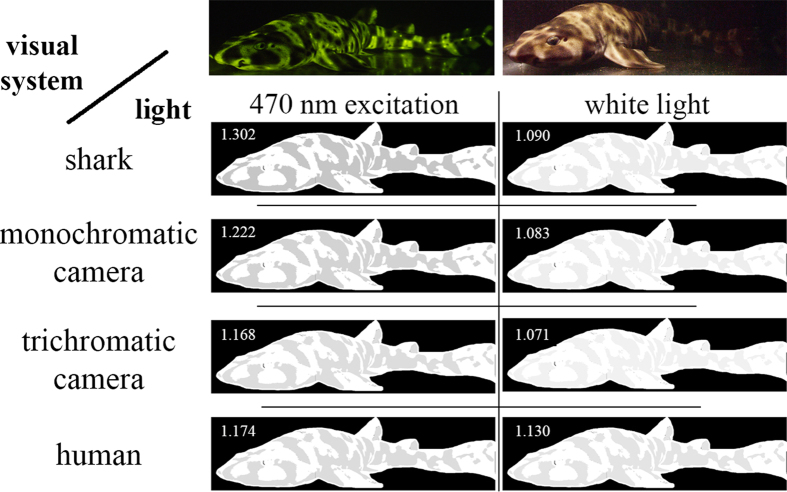
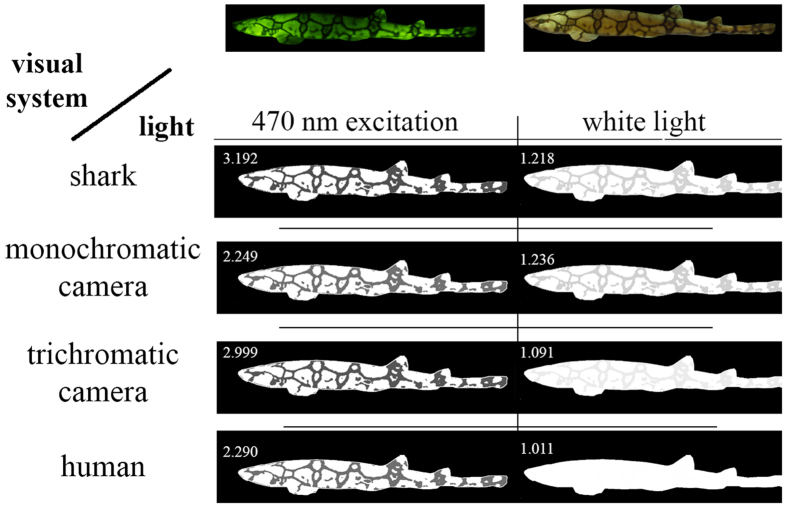
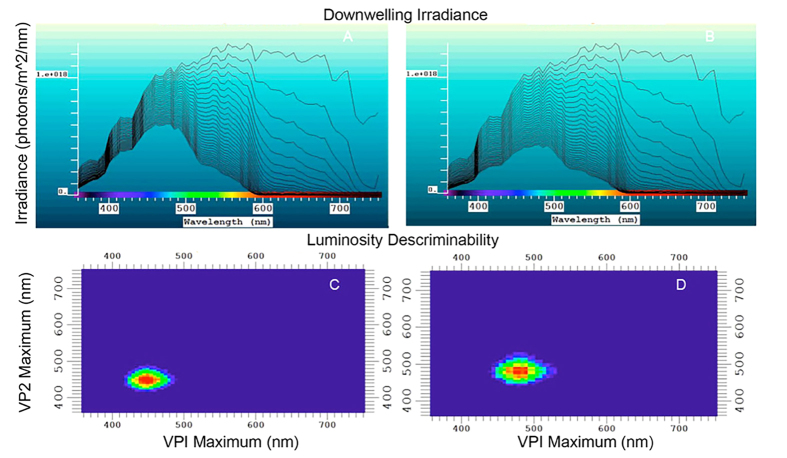
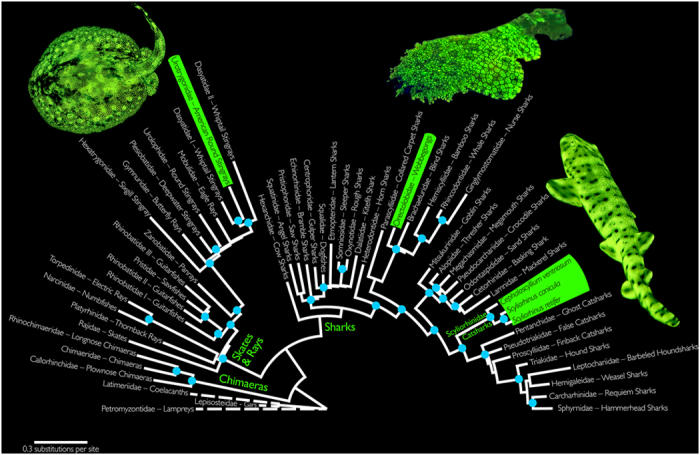
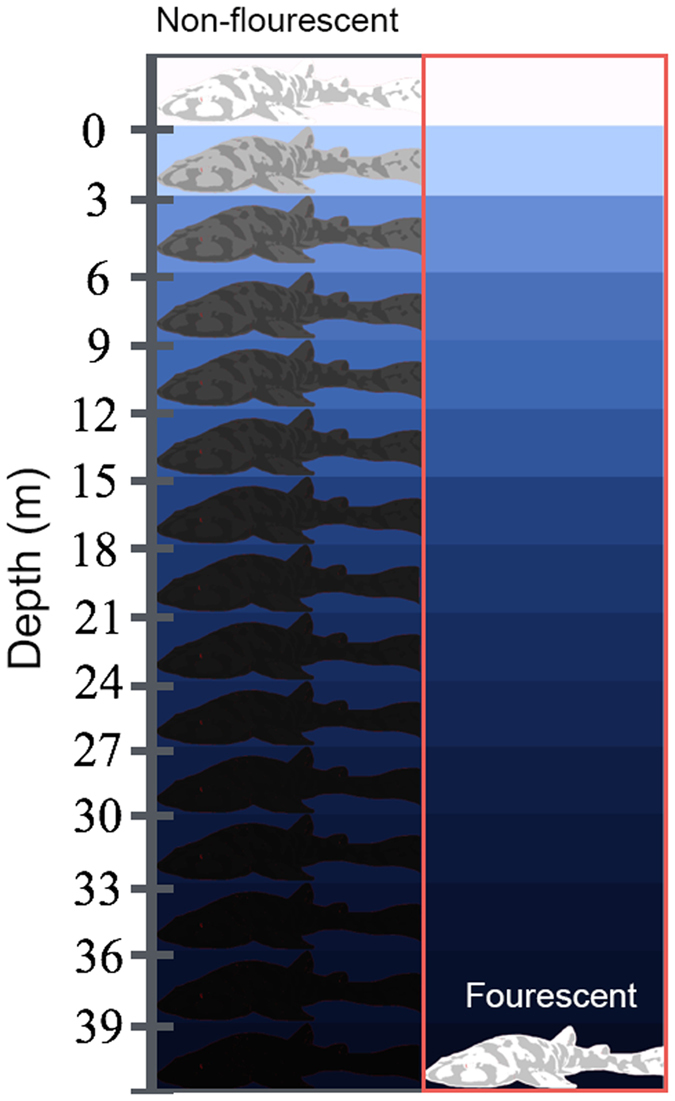
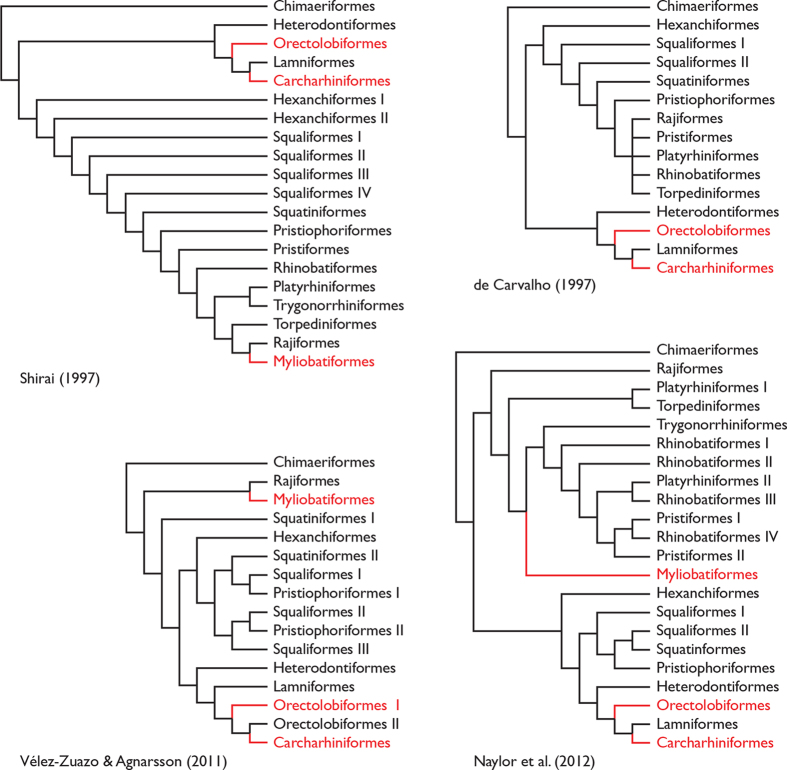
Biofluorescence has recently been found to be widespread in marine fishes, including sharks. Catsharks, such as the Swell Shark (Cephaloscyllium ventriosum) from the eastern Pacific and the Chain Catshark (Scyliorhinus retifer) from the western Atlantic, are known to exhibit bright green fluorescence. We examined the spectral sensitivity and visual characteristics of these reclusive sharks, while also considering the fluorescent properties of their skin. Spectral absorbance of the photoreceptor cells in these sharks revealed the presence of a single visual pigment in each species. Cephaloscyllium ventriosum exhibited a maximum absorbance of 484 ± 3 nm and an absorbance range at half maximum (λ1/2max) of 440-540 nm, whereas for S. retifer maximum absorbance was 488 ± 3 nm with the same absorbance range. Using the photoreceptor properties derived here, a "shark eye" camera was designed and developed that yielded contrast information on areas where fluorescence is anatomically distributed on the shark, as seen from other sharks' eyes of these two species. Phylogenetic investigations indicate that biofluorescence has evolved at least three times in cartilaginous fishes. The repeated evolution of biofluorescence in elasmobranchs, coupled with a visual adaptation to detect it; and evidence that biofluorescence creates greater luminosity contrast with the surrounding background, highlights the potential importance of biofluorescence in elasmobranch behavior and biology.


Figures

Figure 1
Figure 1
(a) Microspectrophotometry data from Celphaloscyllium ventriosum and Scyliorhinus retifer. Maximum absorbance of 484 and 488 nm, respectively. (b) Long rods of S. retifer (scale =10 μm).
Figure 2
Figure 2. Spectral characterization of C. ventriosum.
(a) Fluorescence spectra following excitation at 355, 390, and 470 nm from black areas of the skin, using hyperspectral imaging analysis. (b) Same analysis from beige areas of the skin. (C) Excitation emission matrix (log scale representation) after extraction of fluorescent compounds from skin in methanol solvent, which included both black and beige areas.
Figure 3
Figure 3. Spectral characterization of S. retifer.
(a) Fluorescence spectra following excitation at 355, 390, and 470 nm from black colored areas of the skin, using hyperspectral imaging analysis. (b) Same analysis from beige colored areas of the shark skin. (c) Excitation emission matrix (log scale representation) after extraction of fluorescent compounds from skin in methanol solvent, which included both black and beige areas.
Figure 4
Figure 4
(a) Fluorescent (excitation 450–500 nm; emission 514 LP), and (b) white light image of a 54.0 cm female swell shark (Cephaloscyllium ventriosum).
Figure 5
Figure 5
(a–d) Fluorescent and white light pigmentation pattern of a female chain catshark (Scyliorhinus retifer, 32.2 cm; and (e–h) of a male S. retifer (26.4 cm). Males have pelvic claspers that fluoresce, whereas the females lack claspers, and the reticulated pigmentation pattern is more pronounced in females (thicker dark black/brown lines), particularly ventrally, under both fluorescent and white lighting.
Figure 6
Figure 6
Cephaloscyllium ventriosum in its natural environment in Scripps Canyon (San Diego) under (a) white light; (b) natural light; (c) when excited with 450/70 nm calumniated lighting and imaged with a 514 nm long-pass emission filter.
Figure 7
Figure 7. Scientific biofluorescent imaging camera and lighting system developed to obtain 4 K imagery shown underwater in Scripps Canyon, San Diego, CA. Image courtesy of Kyle McBurnie.
Figure 8
Figure 8. “Shark-eye” imaging was done by fitting three lens filters on the Red Epic camera, and keeping the blue channel response of the resulting system.
Camera sensor response after the placement of the lens filters closely matches the visual pigment of Cephaloscyllium ventriosum and Scyliorhinus retifer. The transmission through the lens was assumed to be 100% for practical purposes.
Figure 9
Figure 9. Beige/black patch intensity between the actual “shark-eye” camera, and our simulation.
Image taken while holding an underwater spectra paper.
Figure 10
Figure 10. Cephaloscyllium ventriosum model of the shark eye as a monochromatic human with the spectral sensitivity curves given in Fig. 1.
Reflectance spectra for darkly pigmented and beige skin components of each shark species from Fig. 2 taken under white light, and emitted after exposure to 470 nm monochromatic light. Radiance and fluorescence spectra for dark and beige skin components of each shark species were converted into XYZ tri-stimulus values and then to sRGB color space.
Figure 11
Figure 11. Scyliorhinus retifer model of the shark eye as a monochromatic human with the spectral sensitivity curves given in Fig. 1.
Reflectance spectra for dark and beige skin components of each shark species from Fig. 2 taken under white light, and emitted after exposure to 470 nm monochromatic light. Radiance and fluorescence spectra for dark and beige skin components of each shark species were converted into XYZ tri-stimulus values and then to sRGB color space.
Figure 12
Figure 12
Calculated downwelling irradiance curves from 1 meter to 30 meters depth in (A) oligotrophic blue water, (B) more productive blue/green water that a visual pigment for 485 nm (such as in C. ventriosum) would have been best matched. (C) Locus of the visual pigments best able to discriminate targets against the background based on luminosity at 30 meters depth in blue water, and (D) in blue/green water. In both cases, the locus is such that quantum catch in the given water type is matched as expected from the “contrast hypothesis.” Red loci are the optimal with those of other colors showing decreasing optimization.
Figure 13
Figure 13. Family-level maximum likelihood phylogeny of elasmobranchs (species level phylogeny presented in Supp. Fig. 5).
Blue circles on nodes indicate bootstrap support values ≥70%. Representatives of the three known biofluorescent elasmobranch clades are highlighted in green. Outgroups are marked with dashed lines. Image of biofluorescent orectolobid © BioPixel.
Figure 14
Figure 14. Heuristic illustration of the effect of fluorescence on the appearance of the swell shark, simulated from the perspective of other swell sharks.
The left column shows the appearance of the shark based on the reflectance spectra of the skin and ambient light; the right column shows how the appearance changes when fluorescence is emitted due to excitation by narrowband light. The blue colors in each box are the RGB renderings of ambient light at that depth simulated using in situ irradiance measurements from Eilat, Israel (the most comprehensive published depth-gradient spectral data currently available). The white and gray patches in each shark drawing are scaled to show relative contrast rather than absolute colors. This illustration demonstrates that if the patches of the shark skin did not fluoresce, the contrast between the light and dark patches diminish with depth and the shark would match the background at depth. Fluorescence increases contrast between the dark/light patches of the shark by providing light spectra not naturally present in the blue ocean environment.
Figure 15
Figure 15. Previous phylogenetic hypotheses of elasmobranchs based on morphological data or DNA-sequence data highlighting the evolution of biofluorescence (red).
In many cases the relevant biofluorescent families or genera were not included in these analyses, so optimizations are based on ordinal level presence only.

References

    1. Gruber D. F., Kao H.-T., Janoschka S., Tsai J. & Pieribone V. a. Patterns of fluorescent protein expression in Scleractinian corals. Biol. Bull. 215, 143–154 (2008). - PubMed
    1. Alieva N. O. et al.. Diversity and evolution of coral fluorescent proteins. Plos ONE 3, e2680 (2008). - PMC - PubMed
    1. Roth M. S. & Deheyn D. D. Effects of cold stress and heat stress on coral fluorescence in reef-building corals. Sci. Rep. 3, 1421 (2013). - PMC - PubMed
    1. Sparks J. S. et al.. The Covert World of Fish Biofluorescence: A Phylogenetically Widespread and Phenotypically Variable Phenomenon. Plos ONE 9, e83259 (2014). - PMC - PubMed
    1. Gruber D. F. & Sparks J. S. First Observation of Fluorescence in Marine Turtles. Am. Museum Novit. 3845, 1–8 (2015).

Publication types

Substances

LinkOut - more resources