. 2016 Apr 25:6:24626.
doi: 10.1038/srep24626.

PSD95 nanoclusters are postsynaptic building blocks in hippocampus circuits

Affiliations

PSD95 nanoclusters are postsynaptic building blocks in hippocampus circuits

Matthew J Broadhead et al. Sci Rep. .

Abstract

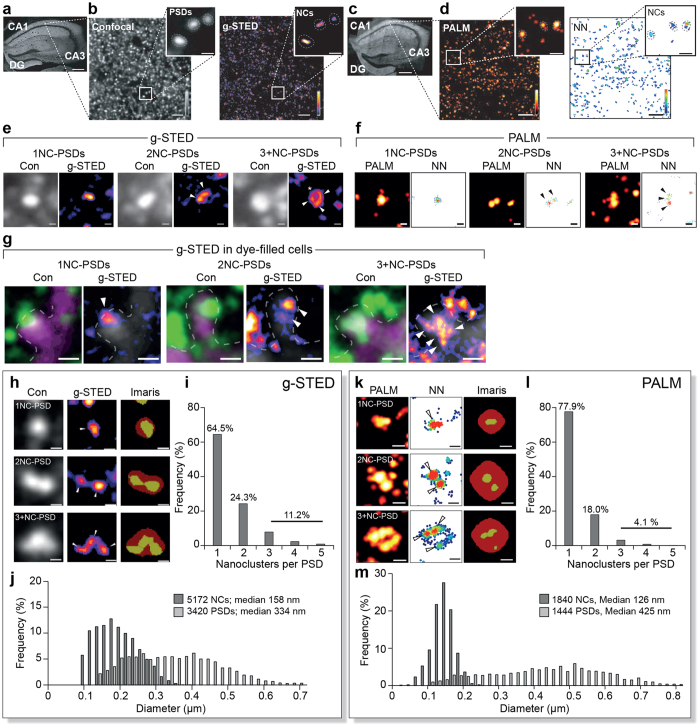
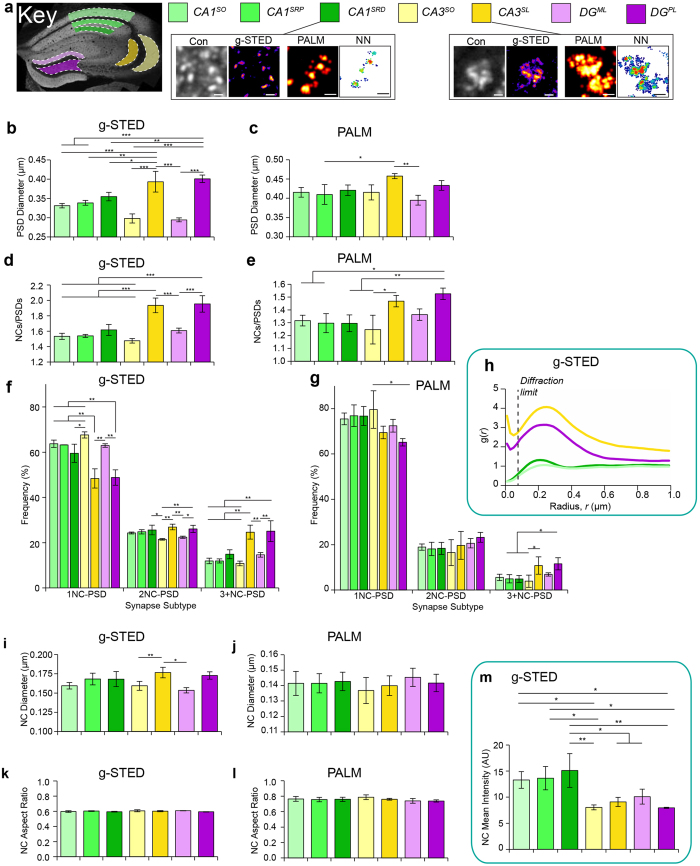
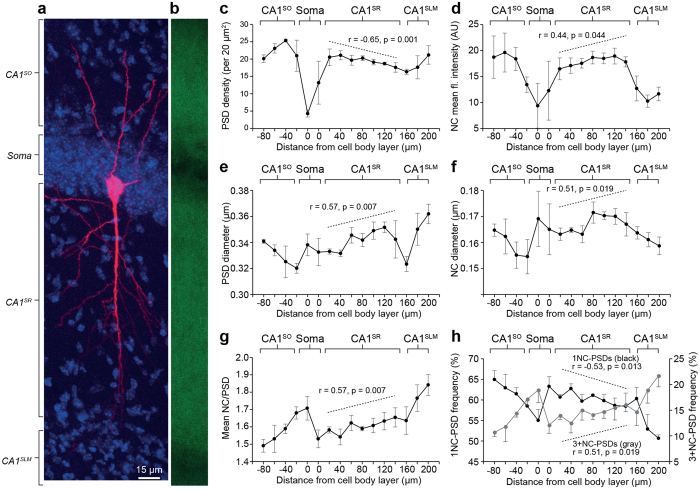
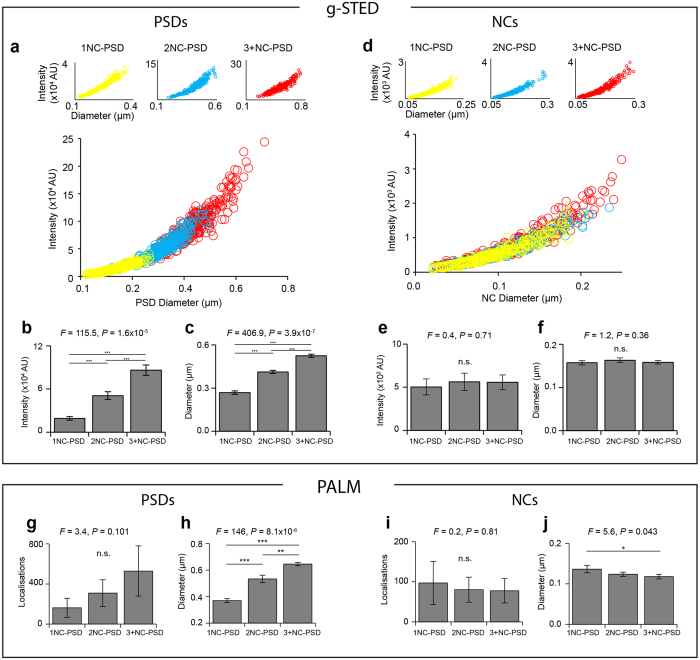
The molecular features of synapses in the hippocampus underpin current models of learning and cognition. Although synapse ultra-structural diversity has been described in the canonical hippocampal circuitry, our knowledge of sub-synaptic organisation of synaptic molecules remains largely unknown. To address this, mice were engineered to express Post Synaptic Density 95 protein (PSD95) fused to either eGFP or mEos2 and imaged with two orthogonal super-resolution methods: gated stimulated emission depletion (g-STED) microscopy and photoactivated localisation microscopy (PALM). Large-scale analysis of ~100,000 synapses in 7 hippocampal sub-regions revealed they comprised discrete PSD95 nanoclusters that were spatially organised into single and multi-nanocluster PSDs. Synapses in different sub-regions, cell-types and locations along the dendritic tree of CA1 pyramidal neurons, showed diversity characterised by the number of nanoclusters per synapse. Multi-nanocluster synapses were frequently found in the CA3 and dentate gyrus sub-regions, corresponding to large thorny excrescence synapses. Although the structure of individual nanoclusters remained relatively conserved across all sub-regions, PSD95 packing into nanoclusters also varied between sub-regions determined from nanocluster fluorescence intensity. These data identify PSD95 nanoclusters as a basic structural unit, or building block, of excitatory synapses and their number characterizes synapse size and structural diversity.


Figures

Figure 1
Figure 1. Super-resolution reveals PSD95 nanostructure and synaptic diversity in brain tissue.
(a) Coronal section of the hippocampus from a PSD95-eGFP mouse. CA1, CA3 and dentate gyrus (DG) regions are shown. Scale bar 250 μm. (b) Left panel, confocal image from the CA1SO shows PSD95eGFP puncta, corresponding to PSDs (expanded inset). Scale bar 2 μm, inset images scale bars 500 nm. Right panel, correlative g-STED image reveals NCs. (c) Coronal section of the hippocampus from a PSD95-mEos2 mouse. CA1, CA3 and dentate gyrus (DG) regions are shown. Scale bar, 250 μm. (d) Left panel, PALM image from the CA1SO of PSD95-mEos2 sections. Scale bars 2 μm, inset images scale bars 500 nm. Right panel, image rendered with nearest neighbour (NN) analysis reveals structures showing significant sub-clustering indicating NCs. (e) Examples of synapse subtypes defined by the number of NCs (white arrowheads) per PSD observed using g-STED. Left panel corresponds to the confocal image and right panel corresponds to the super-resolved image. Asterisk indicates multiple NCs in a ring-like conformation. Scale bars 200 nm. (f) Synapse subtypes defined by the number of NCs (black arrows) per PSD, observed using PALM. Scale bars 200 nm. (g) Dye-filled neurons show single (1NC-PSD) and multiple NCs (2NC-PSD, 3+NC-PSD) in spine heads. Left panel, PSD95-eGFP (green) imaged with a confocal (Con) microscope and the Alexa Fluor 594-filled spine is shown in magenta. Right panel, g-STED image of PSD95-eGFP in same spine. Scale bars 500 nm. White arrowheads, NCs; magenta, Alexa Fluor 594 dye; dotted line, estimated spine membrane location. (h) Example of segmentation of g-STED images of PSDs (red area) and NCs (yellow area) using Imaris Cell. (i) Frequency (%) histogram of the number of NCs per PSD from 3420 PSDs from the CA1SO. (j) Frequency (%) histogram of the diameter of 5172 NCs and 3420 PSDs from the CA1SO. (k) Example of segmentation of PALM images of PSDs (red area) and NCs (yellow area) using Imaris Cell. (l) Frequency (%) histogram of the number of NCs per PSD from 1444 PSDs analysed from the CA1SO. (m) Frequency (%) histogram of the diameters of 1840 NCs and 1444 PSDs from the CA1SO.
Figure 2
Figure 2. PSD95 nanostructural diversity between hippocampal sub-regions.
(a) A colour-coded key to the seven hippocampal sub-regions surveyed, a coding which is maintained for the subsequent panels b–m. CA1 sub-regions are shown in shades of green, CA3 sub-regions in yellow and DG sub-regions in magenta. Image panels from CA1SRD show typical 1NC-PSDs and CA3SL multi-NC-PSDs. Con, confocal; NN, nearest neighbour. Scale bars 500 nm. (b) PSD95-eGFP PSD diameter. (c) PSD95-mEos2 PSD diameter. (d) PSD95-eGFP NC/PSD. (e) PSD95-mEos2 NC/PSD. (f) PSD95-eGFP frequency histogram of synapse subtypes. (g) PSD95-mEos2 frequency histogram of synapse subtypes. (h) Paired Correlation Function (g(r)) analysis from PSD95-eGFP NCs. Denotes the probability of clustering of NCs at a given radius, r. Dotted line denotes the diffraction limit of g-STED. (i) PSD95-eGFP NC diameter. (j) PSD95-mEos2 NC diameter. (k) PSD95-eGFP NC aspect ratio. (l) PSD95-mEos2 NC aspect ratio. (m) Mean fluorescence intensity of PSD95-eGFP NCs. *P < 0.05; **P < 0.01; ***P < 0.001.
Figure 3
Figure 3. Diversity in PSD95-eGFP nanostructure within the CA1 radial gradient.
(a) A CA1 injected pyramidal neuron with dendritic arborisations extending basally into the CA1SO, and apically through the CA1SR and terminating in the CA1SLM. (b) Fluorescence expression of PSD95eGFP in the radial gradient of the hippocampus captured at low magnification (20x) from the same microscopic field as shown in (a). (c) PSD density (per 20 μm2) plotted as a function of distance from the CA1 soma layer. Different sub-fields of the CA1 are denoted with grey bars above the graph. Dotted line describes the Pearsons correlation analysis within the CA1SR. (d) Mean fluorescence intensity of NCs as a function of distance from the CA1 soma layer. (e) PSD diameter as a function of distance from the CA1 soma layer. (f) NC diameter as a function of distance from the soma layer. (g) Mean number of NCs per PSD as a function of distance from the CA1 soma layer. (h) Fractional population (%) of 1NC-PSDs (black line, left axis) and 3+NC-PSDs (grey line, right axis) plotted as a function of distance from the soma layer.
Figure 4
Figure 4. Quantitative analysis of PSD95 building block principle.
Panels a–f show quantifications from g-STED data. (a) Scatter plots of the diameter and integrated fluorescence intensity of 600 randomly selected PSDs from the CA1SO with 200 PSDs from each of the three synapse subtypes plotted in their own respective colour coded plots (upper graph) and plotted together (lower graph). Not only is there a correlation in size and total fluorescence intensity (as expected), but with higher number of NCs per PSD, the size and intensity of PSD fluorescence also become larger. Thus, PSDs in synapses of different subtypes can be characterised by their size and intensity. (b) Histogram of PSD integrated intensity values in different synapse subtypes. (c) Histogram of PSD diameters in different synapse subtypes. (d) Scatter plots of the diameter and integrated fluorescence intensity of 600 randomly selected NCs from the CA1SO with 200 NCs from each of the three synapse subtypes plotted in their respective colour coded plots (upper graph) and plotted together (lower graph). While there is an expected positive correlation between the size and integrated fluorescence intensity of NCs, little difference is observed between the three populations. Thus, NCs belonging to different synapse subtypes are similar structures. (e) Bar chart of the integrated intensity of NCs from different synapse subtypes. (f) Bar chart of the diameter of NCs from different synapse subtypes. Panels g–j show quantifications from PALM data. (g) Histogram of total PSD localisations in different synapse subtypes. (h) Histogram of PSD diameters in different synapse subtypes. (i) Histogram of the total NC localisations in different synapse subtypes. (j) Histogram of NC diameters in different synapse subtypes.

References

    1. Andersen P., Morris R., Amaral D., Bliss T., & O’Keefe J., editors. The hippocampus book. (Oxford University Press, 2007).
    1. Harris K. M. & Landis D. M. Membrane structure at synaptic junctions in area CA1 of the rat hippocampus. Neuroscience 19, 857–872 (1986). - PubMed
    1. Chicurel M. E. & Harris K. M. Three-dimensional analysis of the structure and composition of CA3 branched dendritic spines and their synaptic relationships with mossy fiber boutons in the rat hippocampus. J Comp Neurol. 325, 169–182 (1992). - PubMed
    1. Schikorski T. & Stevens C. F. Quantitative ultrastructural analysis of hippocampal excitatory synapses. J Neurosci. 17, 5858–5867 (1997). - PMC - PubMed
    1. Harris K. M. & Weinberg R. J. Ultrastructure of Synapses in the Mammalian Brain. Cold Spring Harb Perspect Biol. 4, doi: 10.1101/cshperspect.a012526 (2012). - DOI - PMC - PubMed

Publication types

Substances