. 2016 Mar 3;40(2):74-85.
doi: 10.3109/01658107.2015.1136654. Epub 2016 Feb 25.

Time Course of Macular and Peripapillary Inner Retinal Thickness in Non-arteritic Anterior Ischaemic Optic Neuropathy Using Spectral-Domain Optical Coherence Tomography

Affiliations

Time Course of Macular and Peripapillary Inner Retinal Thickness in Non-arteritic Anterior Ischaemic Optic Neuropathy Using Spectral-Domain Optical Coherence Tomography

Katsutoshi Goto et al. Neuroophthalmology. .

Abstract

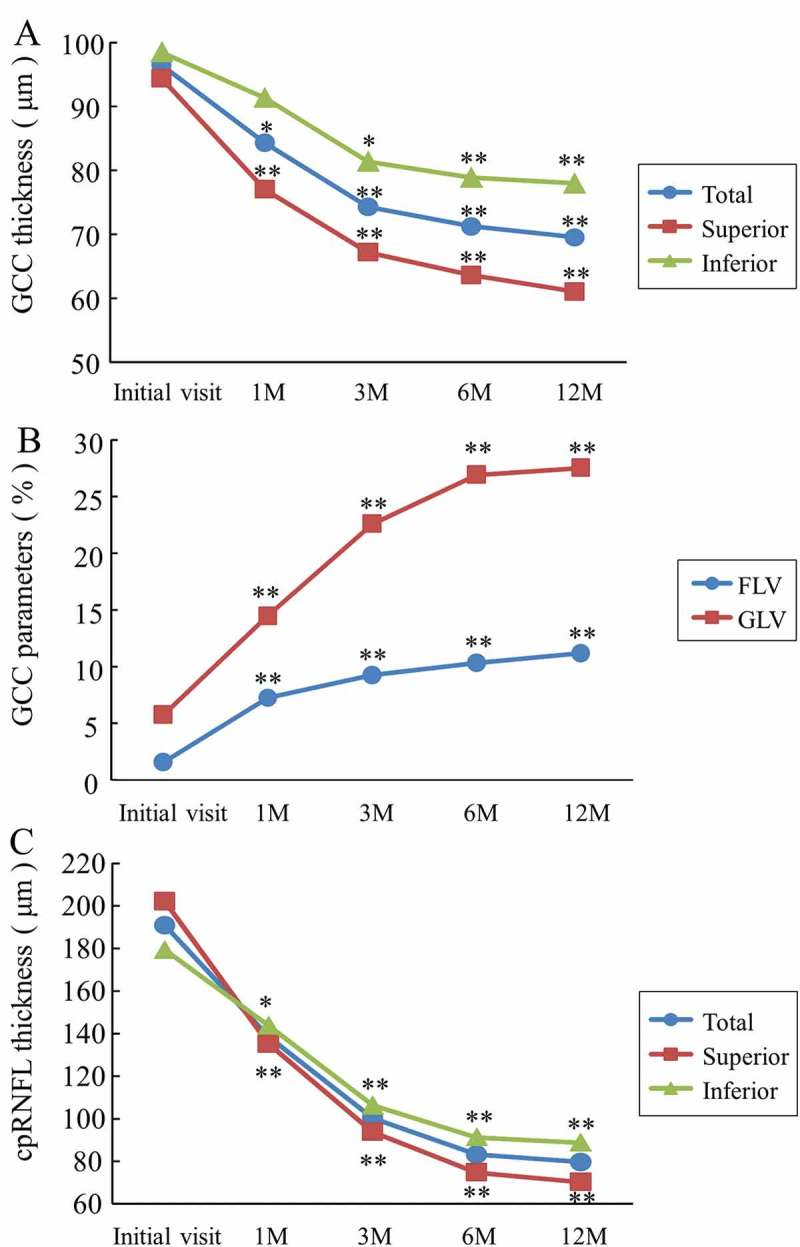
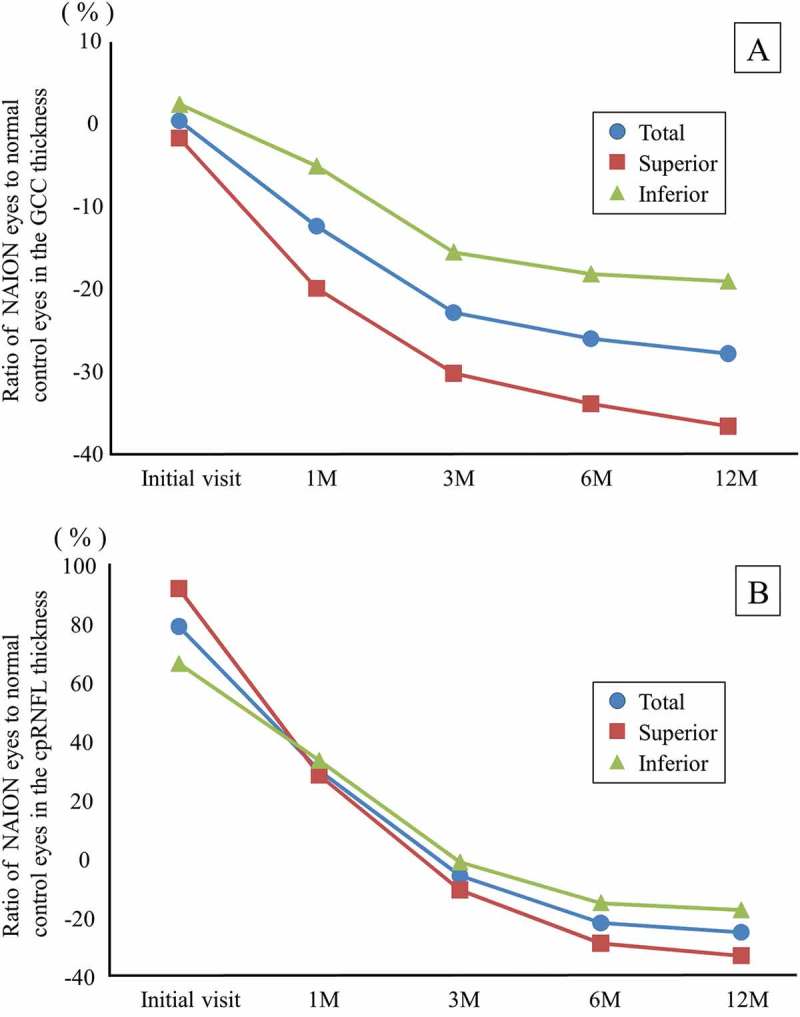
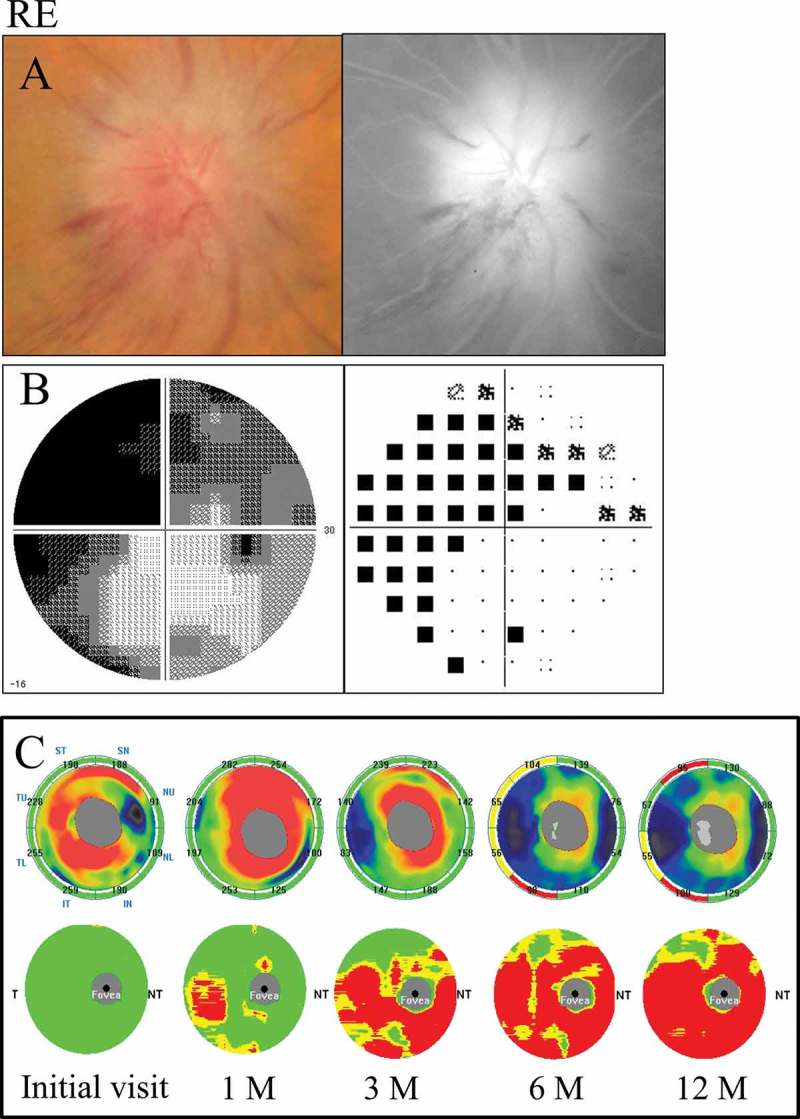
To report a time course of the ganglion cell complex (GCC) and circumpapillary retinal nerve fibre layer (cpRNFL) thicknesses using spectral-domain optical coherence tomography in patients with non-arteritic anterior ischaemic optic neuropathy (NAION), five patients with unilateral NAION were studied (the average age of 66.8 ± 7.8 years old). Forty-one age-matched normal controls were also enrolled. The GCC and cpRNFL thicknesses were measured at the initial visit and at 1, 3, 6, and 12 months using RTVue-100. The GCC thickness and the cpRNFL thickness of the patients were compared with those of the normal controls. The GCC thickness in the NAION patients was 96.49 μm at the initial visit, 84.28 μm at 1 month, 74.26 μm at 3 months, 71.23 μm at 6 months, and 69.51 μm at 12 months. The values at 1, 3, 6, and 12 months were significantly reduced (p < 0.01). The cpRNFL thickness at the initial visit was significantly increased, whereas the values at 6 and 12 months were significantly reduced (p < 0.01). The GCC thickness is more useful for the detection of retinal ganglion cell loss at an early stage than the cpRNFL thickness, because the GCC thickness is unaffected by optic disc swelling at the initial visit, unlike the cpRNFL thickness.

Keywords: Anterior ischaemic optic neuropathy; ganglion cell complex; retinal ganglion cell; retinal nerve fibre layer; spectral-domain optical coherence tomography.


Figures

Figure 1.
Figure 1.
Measurements of the GCC and cpRNFL thicknesses using the RTVue-100. (A) The GCC protocol. The GCC measurements consisted of one horizontal line scan 7 mm in length and 15 vertical line scans 7 mm in length taken at 0.5-mm intervals in a 7 × 7 mm area. The GCC thickness was defined as the distance between the inner limiting membrane and the outer border of the inner plexiform layer. (B) The ONH protocol. The ONH measurements were performed with 13 concentric circle ring scans and 12 radial line scans. GCC = ganglion cell complex; cpRNFL = circumpapillary retinal nerve fibre layer; ONH: optic nerve head map; RE: right eye.
Figure 2.
Figure 2.
The time course of SD-OCT parameters in the NAION patients. (A) The GCC thickness. There was a significant reduction of the total and superior GCC thicknesses observed at 1 month compared with those at the initial visit (*p < 0.05 and **p < 0.01, respectively). (B) The GCC parameters. The FLV and GLV were significantly increased at 1 month compared with the initial visit (**p < 0.01). (C) The cpRNFL thickness. Each cpRNFL thickness was significantly reduced at 1 month compared with the value at the initial visit (total and superior: **p < 0.01, inferior: *p < 0.05). SD-OCT = spectral domain optical coherence tomography; NAION = non-arteritic anterior ischaemic optic neuropathy; FLV = focal loss volume; GLV = global loss volume.
Figure 3.
Figure 3.
The time course of the mean ratio of the GCC and cpRNFL thickness in the NAION eyes to the normal control eyes. (A) The GCC thickness. The reduction rate of the GCC thickness at 12 months was the highest in the superior region. (B) The cpRNFL thickness. The superior cpRNFL thickness was significantly increased at the initial visit, and the loss rate was the highest at 12 months.
Figure 4.
Figure 4.
A 66-year-old female with inferior altitudinal field loss (case 1). (A) Left: a fundus photograph showed optic disc swelling; Right: FA images showed leakage of the optic disc. (B) Left: grey scale; Right: pattern deviation. The Humphrey visual field test showed inferior altitudinal field loss along the horizontal meridian. (C) Top: the cpRNFL significance map; Bottom: the GCC significance map. The cpRNFL significance map was increased at the initial visit and at 1 month due to optic disc swelling, and a significant reduction was observed at 3 months in the superior temporal sectors. The GCC significance map at 1 month showed thinning of the superior hemifield along the horizontal meridian corresponding to the inferior altitudinal field loss. The thinning area gradually spread over time. LE = left eye.
Figure 5.
Figure 5.
A 72-year-old male with diffuse visual field loss that was more dense superiorly (case 5). (A) Left: a fundus photograph showed severe optic disc swelling with splinter haemorrhage; Right: FA images showed the leakage of the optic disc and a filling delay in the inferior region. (B) Left: grey scale; Right: pattern deviation. The Humphrey visual field test showed diffuse visual field loss that was more dense in the superiorly. (C) Top: the cpRNFL significance map; Bottom: the GCC significance map. The cpRNFL significance map was increased until 3 months due to optic disc swelling, and significant thinning was observed in the inferior sectors at 6 months and in the superior and inferior sectors at 12 months. The GCC significance map showed thinning of the area at 1 month after the onset. Moreover, the GCC thickness at 3 months indicated predominant thinning of the inferior hemifield corresponding to the diffuse visual field loss, which was denser in the superior region. However, the thinning area expanded beyond the horizontal meridian over time. The GCC significance map showed good agreement with the visual field loss pattern. RE = right eye.

References

    1. Hattenhauer MG, Leavitt JA, Hodge DO, Grill R, Gray DT.. Incidence of nonarteritic anterior ischemic optic neuropathy. Am J Ophthalmol 1997;123:103–107. - PubMed
    1. Hayreh SS, Zimmerman B.. Visual field abnormalities in nonarteritic anterior ischemic optic neuropathy: their pattern and prevalence at initial examination. Arch Ophthalmol 2005;123:1554–1562. - PubMed
    1. Gerling J, Meyer JH, Kommerell G.. Visual field defects in optic neuritis and anterior ischemic optic neuropathy: distinctive features. Graefes Arch Clin Exp Ophthalmol 1998;236:188–192. - PubMed
    1. Beck RW, Servais GE, Hayreh SS.. Anterior ischemic optic neuropathy. IX. Cup-to-disc ratio and its role in pathogenesis. Ophthalmology 1987;94:1503–1508. - PubMed
    1. Jonas JB, Xu L.. Optic disc morphology in eyes after nonarteritic anterior ischemic optic neuropathy. Invest Ophthalmol Vis Sci 1993;34:2260–2265. - PubMed

LinkOut - more resources