. 2016 Jan 11;5(5):328-339.
doi: 10.1016/j.molmet.2015.12.001. eCollection 2016 May.

Obesogenic memory can confer long-term increases in adipose tissue but not liver inflammation and insulin resistance after weight loss

Affiliations

Obesogenic memory can confer long-term increases in adipose tissue but not liver inflammation and insulin resistance after weight loss

J Schmitz et al. Mol Metab. .

Abstract

Objective: Obesity represents a major risk factor for the development of type 2 diabetes mellitus, atherosclerosis and certain cancer entities. Treatment of obesity is hindered by the long-term maintenance of initially reduced body weight, and it remains unclear whether all pathologies associated with obesity are fully reversible even upon successfully maintained weight loss.

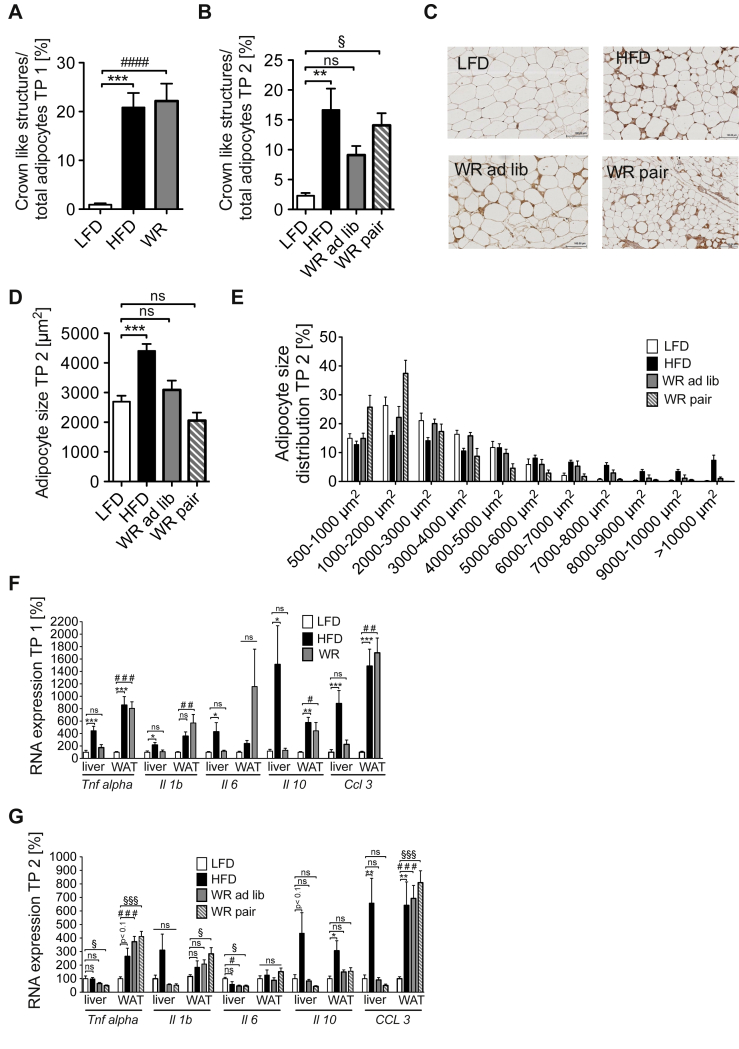
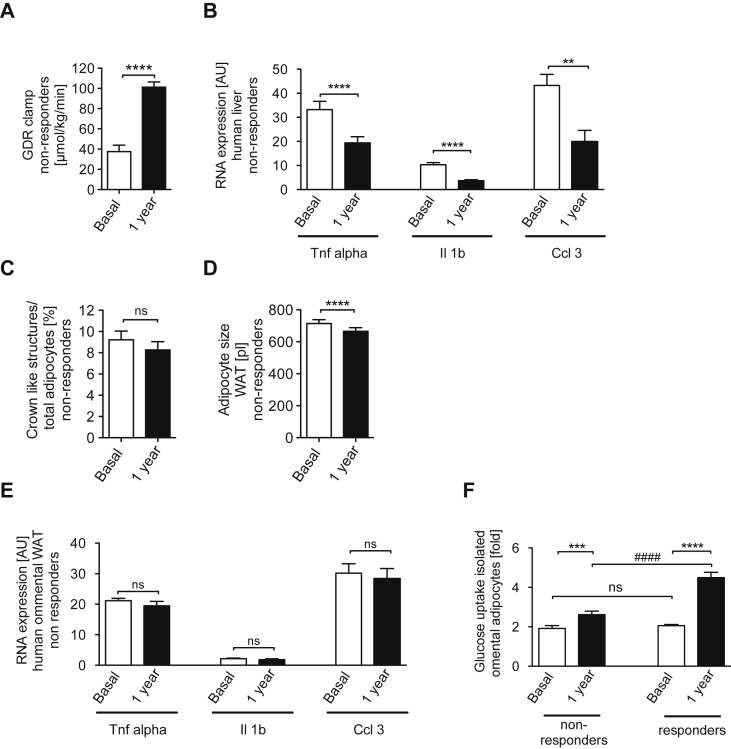
Methods: We compared high fat diet-fed, weight reduced and lean mice in terms of body weight development, adipose tissue and liver insulin sensitivity as well as inflammatory gene expression. Moreover, we assessed similar parameters in a human cohort before and after bariatric surgery.

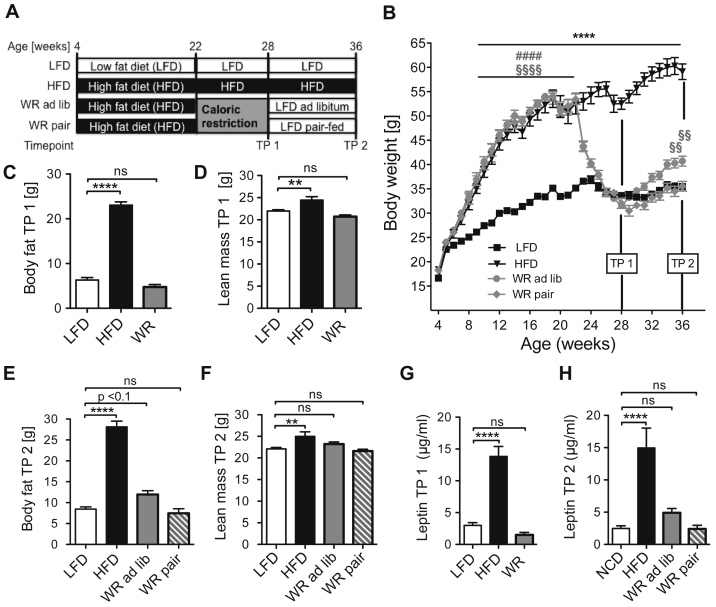
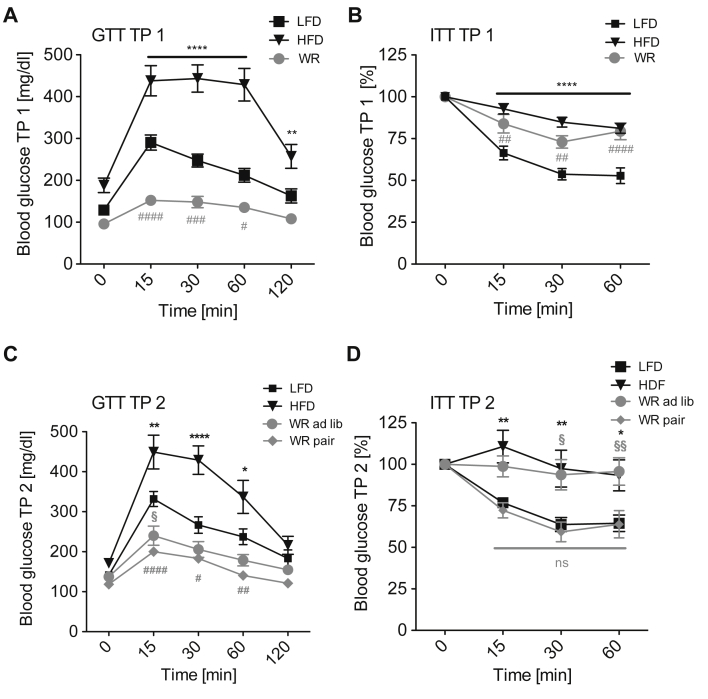
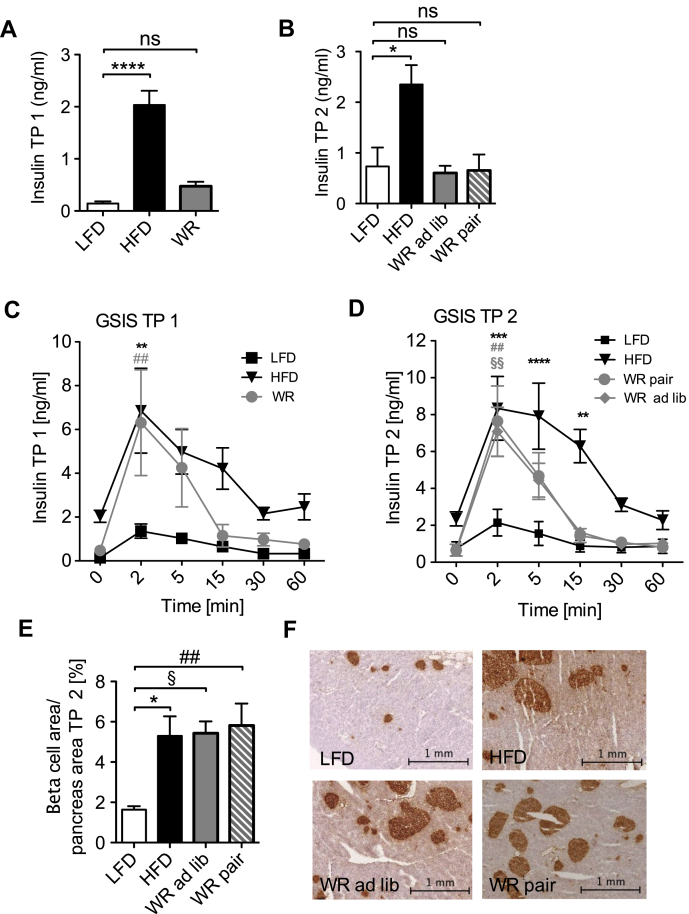
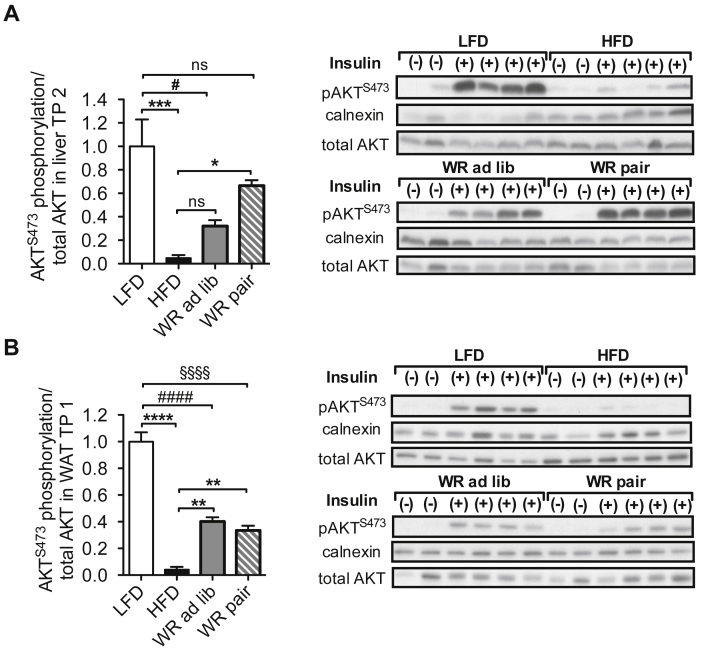
Results: Compared to lean animals, mice that demonstrated successful weight reduction showed increased weight gain following exposure to ad libitum control diet. However, pair-feeding weight-reduced mice with lean controls efficiently stabilized body weight, indicating that hyperphagia was the predominant cause for the observed weight regain. Additionally, whereas glucose tolerance improved rapidly after weight loss, systemic insulin resistance was retained and ameliorated only upon prolonged pair-feeding. Weight loss enhanced insulin action and resolved pro-inflammatory gene expression exclusively in the liver, whereas visceral adipose tissue displayed no significant improvement of metabolic and inflammatory parameters compared to obese mice. Similarly, bariatric surgery in humans (n = 55) resulted in massive weight reduction, improved hepatic inflammation and systemic glucose homeostasis, while adipose tissue inflammation remained unaffected and adipocyte-autonomous insulin action only exhibit minor improvements in a subgroup of patients (42%).

Conclusions: These results demonstrate that although sustained weight loss improves systemic glucose homeostasis, primarily through improved inflammation and insulin action in liver, a remarkable obesogenic memory can confer long-term increases in adipose tissue inflammation and insulin resistance in mice as well as in a significant subpopulation of obese patients.

Keywords: Insulin resistance; Metabolic inflammation; Obesity; Weight loss; Weight regain.


Figures

Figure 1
Figure 1
Weight regain after successful weight reduction. (A) Experimental set up (B) Body weight curve (n = 16 (LFD), 7 (HFD), 10 (WR ad lib), 11 (WR pair)) (C) Lean mass after weight loss TP 1 (n = 17 (LFD), 11 (HFD), 16 (WR)) (D) Fat mass after weight loss TP 1 (n = 17 (LFD), 11 (HFD), 16 (WR)) (E) Lean after weight regain TP 2 (n = 13 (LFD), 7 (HFD), 10 (WR ad lib), 11 (WR pair)) (F) Body fat after weight regain TP 2 (n = 13 (LFD), 7 (HFD), 10 (WR ad lib), 11 (WR pair)) (G) Serum leptin levels after weight loss TP 1 (n = 8 (LFD), 7 (HFD), 8 (WR)) (H) Serum leptin levels after weight regain TP 2 (n = 13 (LFD), 7 (HFD), 10 (WR ad lib), 11 (WR pair)). §, * p < 0.05; §§, ** p < 0.01; §§§§, ****, #### p < 0.0001; (B) 2-Way-ANOVA with Bonferroni's post-test (C)(H) 2-Way-ANOVA with Bonferroni's post-test, level of significance always compared to LFD group unless stated otherwise.
Figure 2
Figure 2
Insulin and glucose tolerance after weight reduction and regain. (A) Glucose tolerance after weight loss TP 1 (n = 16 (LFD), 10 (HFD), 15 (WR)) (B) Insulin tolerance after weight loss TP 1 (n = 15 (LFD), 14 (HFD), 15 (WR)) (C) Glucose tolerance after weight regain TP 2 (n = 12 (LFD), 8 (HFD), 10 (WR ad lib), 11 (WR pair)) (D) Insulin tolerance after weight regain TP 2 (n = 12 (LFD), 10 (HFD), 9 (WR ad lib), 11 (WR pair)). *, #, § p < 0.05; **, ##, §§ p < 0.01; ***, ###, §§§ p < 0.001; ****, #### p < 0.0001; 2-Way-ANOVA with Bonferroni's post-test, significance always compared to LFD group.
Figure 3
Figure 3
Insulin secretion and pancreatic beta-cell islets after weight loss. (A) Fasted serum insulin levels TP 1 (n = 7 (LFD), 7 (HFD), 8 (WR)) (B) Fasted serum insulin levels TP 2 (n = 5 (LFD), 7 (HFD), 6 (WR ad lib), 7 (WR pair)) (C) Glucose stimulated insulin secretion after weight loss TP 1 (n = 7 (LFD), 7 (HFD), 8 (WR)) (D) Glucose stimulated insulin secretion after weight regain TP 2 (n = 5 (LFD), 7 (HFD), 6 (WR ad lib), 7 (WR pair)) (E) Area of pancreatic beta-cells relative to total pancreatic area TP 2 (n = 5 (LFD), 4 (HFD), 5 (WR ad lib), 5 (WR pair)) (F) Insulin peroxidase immunohistochemistry of the pancreas (images are representative for each group). *, §, # p < 0.05; **, §§, ## p < 0.01; *** p < 0.001; **** p < 0.0001; (C)(D) 2-Way-ANOVA with Bonferroni's post-test, (A), (B) & (E) 1-Way-ANOVA with Bonferroni's post-test, level of significance always compared to LFD group unless displayed otherwise.
Figure 4
Figure 4
Tissue specific persistence of insulin resistance after weight loss and regain. (A) AKT S473 phosphorylation relative to total AKT after insulin stimulation in liver tissue (n = 4 (LFD), 4 (HFD), 4 (WR ad lib), 4 (WR pair)) (B) AKT S473 phosphorylation relative to total AKT after insulin stimulation in WAT (n = 4 (LFD), 4 (HFD), 4 (WR ad lib), 4 (WR pair)). #, § p < 0.05; ** p < 0.01, *** p < 0.0001, ****, §§§§, #### p < 0.00001; 1-Way-ANOVA with Bonferroni's post-test.
Figure 5
Figure 5
Inflammation of adipose tissue persists after weight loss. (A) Crown like structures in white adipose tissue relative to total adipocytes after weight loss TP 1 (n = 7 (LFD), 7 (HFD), 8 (WR)) (B) Crown like structures in white adipose tissue relative to total adipocytes after weight regain TP 2 (n = 6 (LFD), 7 (HFD), 4 (WR ad lib), 7 (WR pair)) (C) Immunohistochemical staining of F4/80 positive cell in white adipose tissue after weight regain TP 2 (images representative for each group) (D) Average adipocytes size TP 2 (n = 6 (LFD), 7 (HFD), 5 (WR ad lib), 7 (WR pair)) (E) Adipocyte-size distribution TP 2 (n = 6 (LFD), 7 (HFD), 5 (WR ad lib), 7 (WR pair)) (F) Quantitative RT-PCR analysis of gene expression in WAT and liver TP 1 (n = 6–8 in each group)) (G) Quantitative RT-PCR analysis of gene expression in WAT and liver TP 2 (n = 6–8 in each group). *, #, § p < 0.05; **, ## p < 0.01; ***, ###, §§§ p < 0.001; 1-Way-ANOVA with Bonferroni's post-test.
Figure 6
Figure 6
Differential regulation of inflammation in liver and WAT upon prolonged weight loss in humans. (A) Hyperinsulinemic euglycemic clamp in non-responders before and 1 year after bariatric surgery induced weight loss (n = 11) (B) Quantitative RT-PCR analysis of gene expression in liver of non-responders before and 1 year after bariatric surgery (n = 23) (C) Adipocyte size of non-responders WAT before and 1 year after bariatric surgery (n = 23) (D)) Crown like structures in WAT of non-responders before and 1 year after bariatric surgery (n = 23) (E) Quantitative RT-PCR analysis of gene expression in WAT of non-responders before and 1 year after bariatric surgery (n = 23) (F) Insulin stimulated Glucose uptake into isolated omental adipocytes (non responders: n = 23; responders: n = 32). * p < 0.05; ** p < 0.01; *** p < 0.001; **** p < 0.0001 paired student's t-test; #### p < 0.0001 unpaired student's t-test.

References

    1. Finucane M.M., Stevens G.A., Cowan M.J., Danaei G., Lin J.K., Paciorek C.J. National, regional, and global trends in body-mass index since 1980: systematic analysis of health examination surveys and epidemiological studies with 960 country-years and 9·1 million participants. Lancet. 2011;377:557–567. - PMC - PubMed
    1. Stevens G.A., Singh G.M., Lu Y., Danaei G., Lin J.K., Finucane M.M. National, regional, and global trends in adult overweight and obesity prevalences. Population Health Metrics. 2012;10:22. - PMC - PubMed
    1. W.H. Organisation, http://www.who.int/mediacentre/factsheets/fs311/en/index.html, 2013 (n.d.).
    1. Flegal K.M., Graubard B.I., Williamson D.F., Gail M.H. Cause-specific excess deaths associated with underweight, overweight, and obesity. Journal of American of Medical Association. 2007;298:2028–2037. - PubMed
    1. Leblanc E.S., O'Connor E., Whitlock E.P., Patnode C.D., Kapka T. Effectiveness of primary care-relevant treatments for obesity in adults: a systematic evidence review for the U.S. Preventive Services Task Force. Annals of Internal Medicine. 2011;155:434–447. - PubMed

LinkOut - more resources