. 2016 Feb 10;5(5):366-378.
doi: 10.1016/j.molmet.2016.01.009. eCollection 2016 May.

Inter-domain tagging implicates caveolin-1 in insulin receptor trafficking and Erk signaling bias in pancreatic beta-cells

Affiliations

Inter-domain tagging implicates caveolin-1 in insulin receptor trafficking and Erk signaling bias in pancreatic beta-cells

Tobias Boothe et al. Mol Metab. .

Erratum in

Abstract

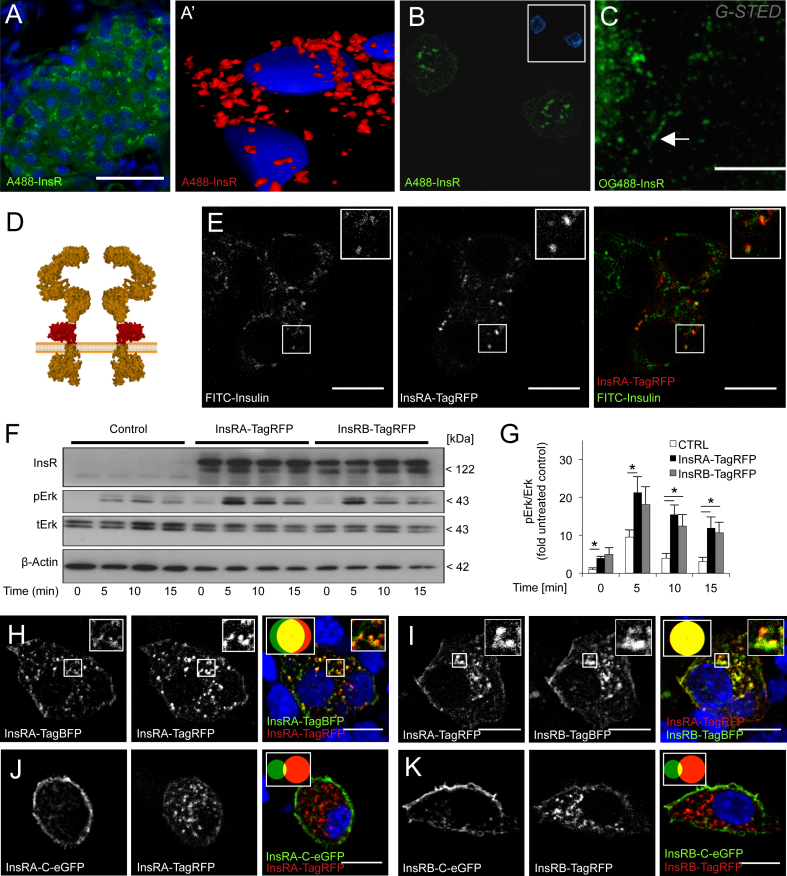
Objective: The role and mechanisms of insulin receptor internalization remain incompletely understood. Previous trafficking studies of insulin receptors involved fluorescent protein tagging at their termini, manipulations that may be expected to result in dysfunctional receptors. Our objective was to determine the trafficking route and molecular mechanisms of functional tagged insulin receptors and endogenous insulin receptors in pancreatic beta-cells.

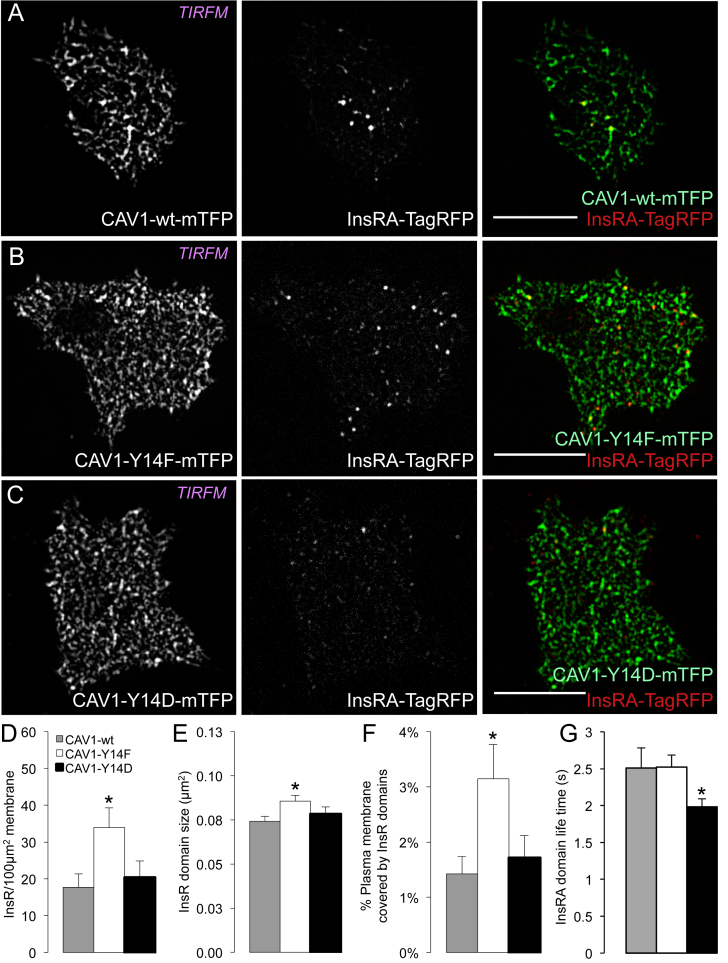
Methods: We generated functional insulin receptors tagged with pH-resistant fluorescent proteins between domains. Confocal, TIRF and STED imaging revealed a trafficking pattern of inter-domain tagged insulin receptors and endogenous insulin receptors detected with antibodies.

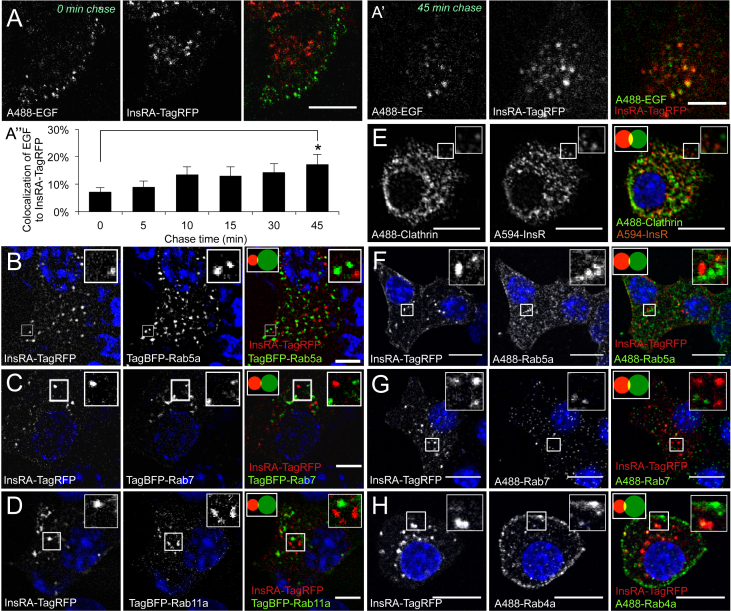
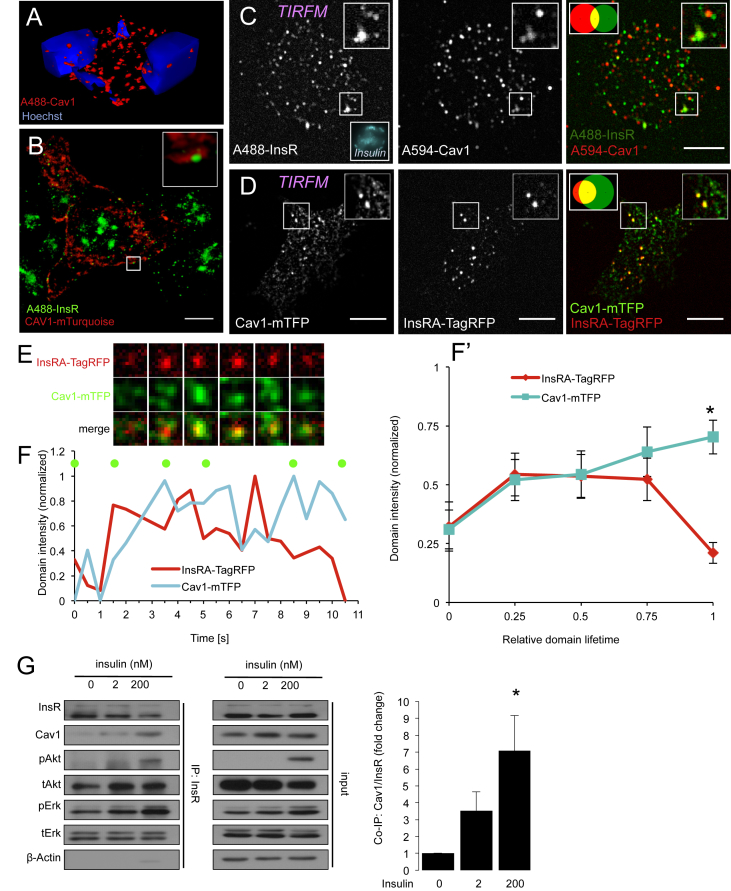
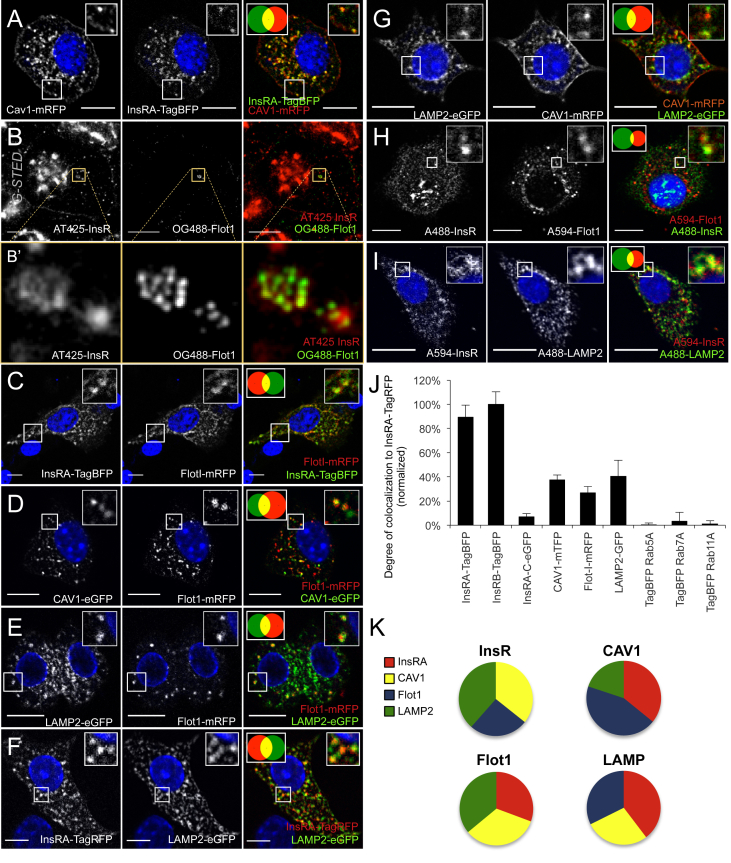
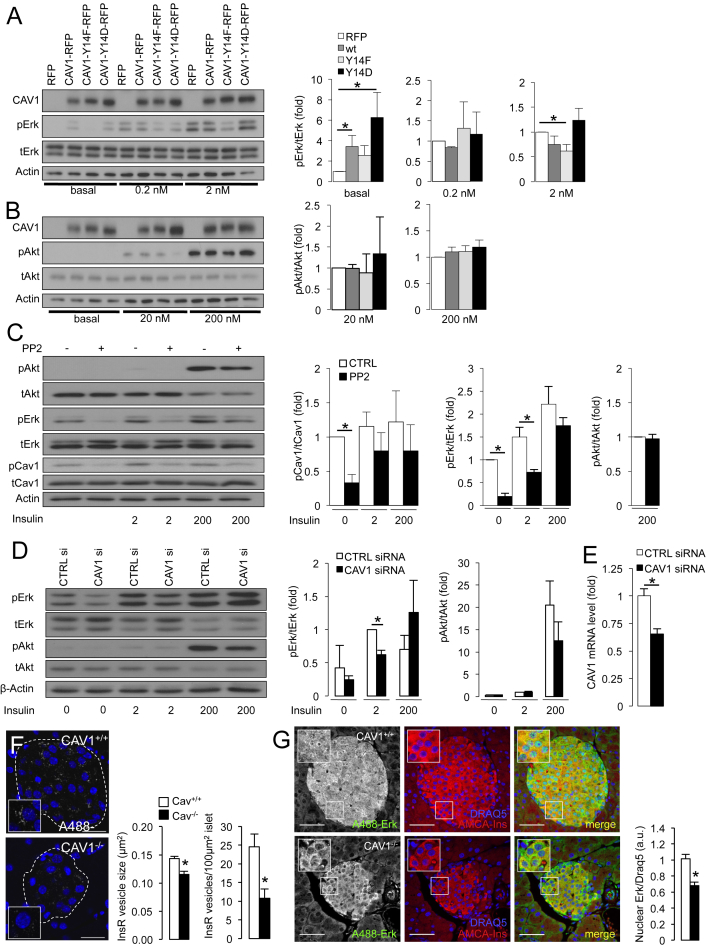
Results: Surprisingly, interdomain-tagged and endogenous insulin receptors in beta-cells bypassed classical Rab5a- or Rab7-mediated endocytic routes. Instead, we found that removal of insulin receptors from the plasma membrane involved tyrosine-phosphorylated caveolin-1, prior to trafficking within flotillin-1-positive structures to lysosomes. Multiple methods of inhibiting caveolin-1 significantly reduced Erk activation in vitro or in vivo, while leaving Akt signaling mostly intact.

Conclusions: We conclude that phosphorylated caveolin-1 plays a role in insulin receptor internalization towards lysosomes through flotillin-1-positive structures and that caveolin-1 helps bias physiological beta-cell insulin signaling towards Erk activation.

Keywords: Autocrine insulin signaling; Insulin receptor internalization; Insulin resistance; Pancreatic islet beta-cells.


Figures

Figure 1
Figure 1
Design and validation of functional fluorescent protein-tagged insulin receptors that mimic endogenous insulin receptor localization. (A) Islets in pancreatic tissue sections from 24 week-old mice are labeled with mouse monoclonal antibody to the insulin receptor and the DRAQ5 DNA stain (blue). Scale bar = 50 μm. (A′) 3D reconstruction of InsR staining in a pancreatic mouse tissue section. (B) Confocal imaging of endogenous insulin receptor localization in dispersed, fixed primary human beta-cells. Insets show AMCA-insulin immunofluorescence. Scale bar = 10 μm. (C) STED super resolution microscopy identifies small ∼80 nm clusters of plasma membrane insulin receptors in fixed MIN6 cells (arrow). Scale bar = 5 μm (D) Schematic of inter-domain tagging strategy used in the present study. Orange structure = InsR; Red structure = TagRFP. (E) Representative confocal image of colocalization between internalized FITC-insulin (200 nM, 1 h) and interdomain-tagged InsRA-TagRFP in live MIN6 cells cultured at 0 mM glucose. Scale bar = 10 μm. (F, G) Expression of InsRA-TagRFP and InsRB-TagRFP sustains Erk phosphorylation in HEK 293T cells stimulated with 50 nM insulin (n = 4) at 0 mM Glucose. (H) Colocalization of identical insulin receptor isoforms tagged with different fluorescent proteins in fixed MIN6 cells (n = 10). Scale bar = 10 μm. Inset Venn diagrams, here and throughout, can be used visualize the colocalization of the color-coded proteins and represent the relative size of the puncta pools and their overlap. (I) Colocalization of fluorescently labeled insulin receptor A and B isoforms in fixed MIN6 cells (n = 10). Identical results were obtained with InsRA-TagBFP and InsRB-TagRFP (not shown). Scale bar = 10 μm. (J, K) C-terminal-tagged insulin receptors have a primarily plasma membrane localization that does not substantially colocalize with interdomain-tagged insulin receptors in fixed MIN6 cells (n = 10). Scale bar = 10 μm
Figure 2
Figure 2
Insulin receptors do not associate with markers of clathrin-dependent endocytosis. (A, A′) Pulse-chase colocalization analysis of Alexafluor488-labeled EGF relative to InsRA-TagRFP indicates separate entry pathways but eventual fusion into a shared mature pool of vesicles in MIN6 cells cultured in 0 mM glucose. A significant increase in the degree of colocalization was observed at a 45 min chase time compared to 0 min chase time (n = 4 images per time point). Scale bar = 5 μm. (B–D) Colocalization analysis of InsRA-TagRFP with TagBFP-tagged Rab5a (early endosomes), TagBFP-Rab7 (late endosomes), and TagBFP-Rab11a (recycling endosomes) in fixed MIN6 cells (n = 10). Similar results observed with InsRB-TagRFP. Scale bar = 5 μm. (E) Colocalization analysis of immunolabeled endogenous insulin receptors with immunolabeled endogenous clathrin in MIN6 cells (n = 10). Scale bar = 10 μm. (F–H) Colocalization analysis of tagged insulin receptors with immunolabeled endogenous Rab5a, Rab7, and Rab4a (alternate marker for recycling endosomes) in MIN6 cells (n = 10). Scale bar = 10 μm. (B–H) Prior fixation, MIN6 cells were cultured in 25 mM glucose.
Figure 3
Figure 3
Caveolin-1 is associated with insulin receptor internalization. (A) 3D reconstruction of subcellular Cav1 staining in murine islets cells of a pancreatic section. (B) STED super-resolution imaging of mTurquoise-tagged Cav1 and endogenous insulin in MIN6 cells. Inset shows Cav1 surrounding a cluster of insulin receptors. Scale bar = 5 μm. (C) Immunolabeling and TIRF microscopy of dispersed human islet cells cultured in 5 mM glucose demonstrates colocalization of endogenous Cav1 to endogenous insulin receptors at the plasma membrane (n = 20 cells). Scale bar = 5 μm. (D) TIRF imaging reveals a high degree of colocalization of Cav1-mTFP to InsRA-TagRFP at the plasma membrane of live MIN6 cells cultured in 20 mM glucose (n = 10). Scale bar = 5 μm. (E, F) Live-cell TIRF imaging in MIN6 cells cultured in 20 mM glucose reveals the reciprocal recruitment of InsRA-TagRFP and Cav1-mTFP to membrane domains prior to the internalization of insulin receptors. Pixel size = 0.129 μm (F, F′) Intensity analysis of a single (F) InsRA-TagRFP positive membrane domain during the process of Cav1 mediated vesicle budding. Green dots correspond to the time points of the images in E. (F′) shows the averaged and normalized intensities of 15 analyzed InsRA-TagRFP positive membrane domains during Cav1 mediated vesicle budding from the plasma membrane of MIN6 cells cultured in 20 mM glucose. *p < 0.05. (G) Co-immunoprecipitation of insulin receptors from NIH-3T3 cells reveals an insulin dependent binding of Cav1 to the insulin receptor (n = 3). NIH-3T3 cells were cultured in 0 mM glucose during insulin treatments for 5 min *p < 0.05
Figure 4
Figure 4
InsR-TagRFP is transported to lysosomes in Cav-1 and Flot-1 positive vesicles. (A) Confocal imaging of Cav1-mRFP and InsRA-TagBFP in MIN6 cells (n = 10). Scale bars = 10 μm. (B) G-STED microscopy in MIN6 cells illustrates the presence of Flot1 on vesicles containing endogenous insulin receptors. Scale bars = 5 μm. (B′) Insets show flotillin-1 positive vesicles harboring insulin receptors. (C–G) Colocalization between InsRA-TagBFP and Flot1-mRFP, Flot1-mRFP and CAV1-eGFP, Flot1-mRFP and LAMP2-eGFP, InsRA-TagRFP and LAMP2-eGFP, CAV1-mRFP and LAMP2-eGFP in MIN6 cells demonstrates a Cav1-Flot1-LAMP2 endocytic trafficking route to lysosomes (n = 10). Scale bars = 10 μm; F: Scale bar = 5 μm. (H, I) Immunolabeling of endogenous insulin receptors, endogenous Flot1, and endogenous LAMP2 (lysosomes) in primary 12 week-old mouse islet cells (n = 10). Scale bars = 10 μm. (J) Summary of object-based colocalization of tagged proteins compared with InsRA-TagRFP in MIN6 cells. Note that InsRA controls represent the maximum colocalization in this system (n = 10 cells per condition). (K) Summary of colocalization within vesicular pools in the Cav1/Flot1/Lamp2 pathway of MIN6 cells (n = 10 cells per condition). (A–I) MIN6 cells were cultured in 25 mM glucose and primary cells were cultured in 11 mM glucose prior fixation.
Figure 5
Figure 5
Caveolin-1 phosphorylation modulates insulin receptor domain size and internalization. (A–C) TIRF microscopy of live MIN6 cells expressing InsRA-TagRFP and Cav1 mutant proteins. Scale bar = 10 μm. (D–F) Overexpression of the Cav1-Y14F mutant leads to increased InsRA-TagRFP domain density, increased InsRA-TagRFP domain size, and a higher content of InsRA-TagRFP at the plasma membrane of fixed MIN6 cells (n = 10 cells per condition). (G) Quantification of TIRF time lapse imaging of InsRA-lum-eGFP domain lifetime at the plasma membrane of stable MIN6 cell lines expressing various Cav1 mutants. *p < 0.05, n > 4 cells per condition. (A–G) MIN6 cells were cultured in 20 mM glucose during image acquisition.
Figure 6
Figure 6
Caveolin-1 enhances insulin-stimulated Erk, but not Akt, signaling in vitro. (A, B) Overexpression of wildtype Cav1-mRFP or the phosphomimetic mutant Cav1-Y14D significantly increases basal insulin signaling to Erk. Erk signaling stimulated by 2 nM added insulin is significantly reduced in cells overexpressing the dominant negative mutant Cav1-Y14F. Akt signaling is unaffected by the overexpression of Cav-1 mutants. Experiments were performed in MIN6 cells treated for 5 min with the indicated doses of insulin (n = 10). (C) Insulin stimulated (5 min) Erk, but not Akt signaling is significantly reduced in NIH-3T3 cells previously treated for 2 h with 10 μM of Src kinase inhibitor PP2 (n = 4). *p < 0.05. (D) Erk, but not Akt signaling is significantly reduced in MIN6 cells treated with Cav1-siRNA and a physiological dose of insulin for 5 min (n = 4). *p < 0.05. (A–D) MIN6 cells and NIH-3T3 cells were incubated in 0 mM glucose during 5 min of insulin treatments. (E) Knockdown efficiency in MIN6 cells cultured at 25 mM glucose and treated with a siRNA pool against murine Cav1 (n = 6 independent samples per condition). *p < 0.05. (F) Reduced insulin receptor immunolabeling of intracellular vesicles in islets of Cav1−/− mice. *p < 0.05. (n = 9 islets). Cav1+/+ = white, Cav1−/− = black, throughout this figure. Scale bar = 25 μm. (G) Reduced Erk signaling visualized by nuclear translocation in islet cells from 12 week old Cav1−/− mice (n = 3 mice, 22 analyzed islets). Scale bar = 50 μm.

Similar articles

Cited by

References

    1. Okada T., Liew C.W., Hu J., Hinault C., Michael M.D., Krtzfeldt J. Insulin receptors in beta-cells are critical for islet compensatory growth response to insulin resistance. Proceedings of the National Academy of Sciences of the United States of America. 2007;104:8977–8982. - PMC - PubMed
    1. Leibiger I.B., Leibiger B., Berggren P.O. Insulin signaling in the pancreatic beta-cell. Annual Review of Nutrition. 2008;28:233–251. - PubMed
    1. Johnson J.D., Alejandro E.U. Control of pancreatic beta-cell fate by insulin signaling: the sweet spot hypothesis. Cell Cycle. 2008;7:1343–1347. - PubMed
    1. Mehran A.E., Templeman N.M., Brigidi G.S., Lim G.E., Chu K.Y., Hu X. Hyperinsulinemia drives diet-induced obesity independently of brain insulin production. Cell Metabolism. 2012;16:723–737. - PubMed
    1. Johnson J.D., Bernal-Mizrachi E., Alejandro E.U., Han Z., Kalynyak T.B., Li H. Insulin protects islets from apoptosis via Pdx1 and specific changes in the human islet proteome. Proceedings of the National Academy of Sciences of the United States of America. 2006;103:19575–19580. - PMC - PubMed