. 2016 Jun;12(6):459-65.
doi: 10.1038/nchembio.2076. Epub 2016 Apr 25.

Click-EM for imaging metabolically tagged nonprotein biomolecules

Affiliations

Click-EM for imaging metabolically tagged nonprotein biomolecules

John T Ngo et al. Nat Chem Biol. 2016 Jun.

Abstract

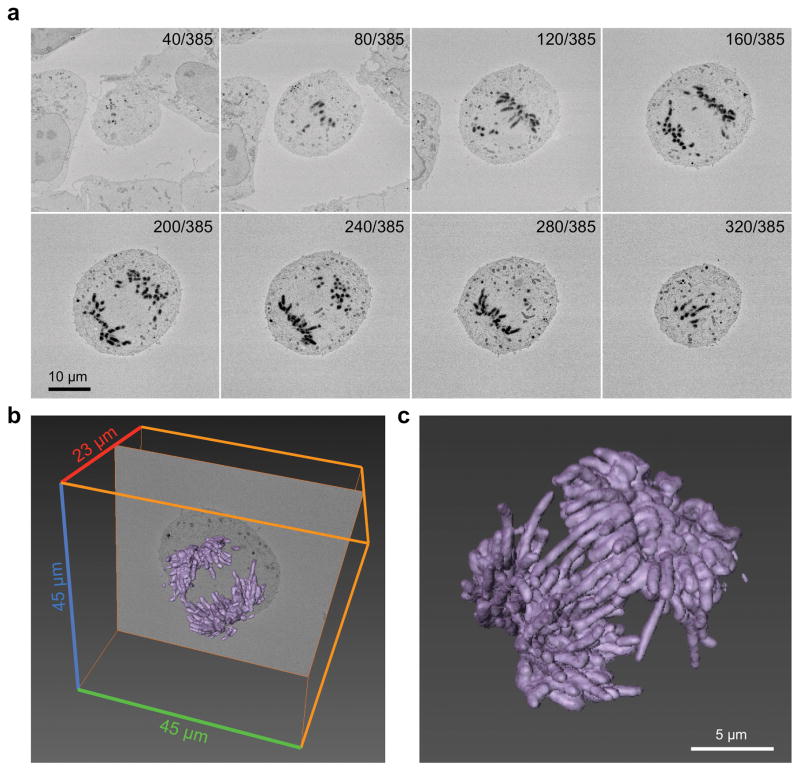
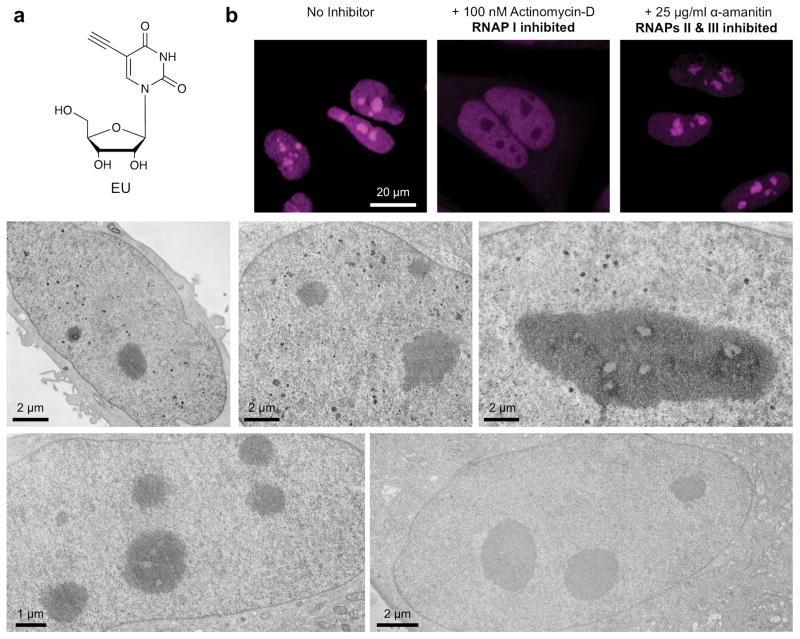
EM has long been the main technique for imaging cell structures with nanometer resolution but has lagged behind light microscopy in the crucial ability to make specific molecules stand out. Here we introduce click-EM, a labeling technique for correlative light microscopy and EM imaging of nonprotein biomolecules. In this approach, metabolic labeling substrates containing bioorthogonal functional groups are provided to cells for incorporation into biopolymers by endogenous biosynthetic machinery. The unique chemical functionality of these analogs is exploited for selective attachment of singlet oxygen-generating fluorescent dyes via bioorthogonal 'click chemistry' ligations. Illumination of dye-labeled structures generates singlet oxygen to locally catalyze the polymerization of diaminobenzidine into an osmiophilic reaction product that is readily imaged by EM. We describe the application of click-EM in imaging metabolically tagged DNA, RNA and lipids in cultured cells and neurons and highlight its use in tracking peptidoglycan synthesis in the Gram-positive bacterium Listeria monocytogenes.


Conflict of interest statement

COMPETING FINANCIAL INTERESTS

The authors declare no competing financial interest.

Figures

Figure 1
Figure 1. Click-EM imaging of EdU-labeled HeLa cells
(a) Schematic depicting how 1O2 is used to generate EM contrast. (b) Schematic depicting the metabolic labeling and CuAAC reaction steps of the Click-EM procedure. Structures of EdU, DBF-azide, and their CuAAC ligation product are shown. (c) Fluorescence and transmitted light images of EdU-labeled HeLa cells following CuAAC ligation with DBF-azide. Transmitted light images before (middle) and after (right) photooxidation are shown; polymeric DAB precipitates accumulated during the illumination period appear as optically dense deposits that overlay with DBF-azide emission. (d) Photooxidized cells following osmium staining. Osmium stained DAB precipitates appear brown under white light. The dotted blue line defines the area of illumination. (e) Correlated light and EM images of a mitotic cell labeled with EdU and DBF-azide. The set of four images on the left were obtained by light microscopy and correspond to the same cell shown the middle and right images, which were obtained by EM. (f–m) EM images of EdU labeled HeLa cells: (f) a non-photooxidized cell, (g–i) S- or G2-phase cells, (j–m) mitotic cells.
Figure 2
Figure 2. SBEM imaging of EdU-labeled HEK293 cells
(a) Montage of selected 2-dimensional (45μm × 45μm) images collected by SBEM. (b) A sum of 385 individual images from the area shown in (a) were used to reconstruct the full 3-dimesional volume of an EdU-labeled mitotic cell. Images were collected serially along the z-axis at 60 nm intervals (z-dimension distance = 23 μm). Signal intensity arising from EdU-labeled DNA is shown in purple. (c) A three-dimensional rendering of the signal arising from OsO4-stained DAB deposits.
Figure 3
Figure 3. Imaging of nascent transcripts using EU
a) Structure of EU. (b) Fluorescence detection of EU-labeled transcripts in HeLa cells following CuAAC ligation with DBF-azide. (c–g) EM micrographs of EU labeled cells: (c–e) uninhibited HeLa cells exhibiting darkly stained nucleoli, diffuse nucleoplasmic labeling, and stained nucleoplasmic intensities; (f) the nucleus of a HeLa pulsed with EU in the presence of α-amanitin (for inhibition of RNAP II and III) exhibiting darkly stained nucleoli, but without stained nucleoplasmic intensities; (g) the nucleus of a non-photooxidized cell.
Figure 4
Figure 4. Click-EM imaging of AzCho labeled HeLa cells
(a) Schematic depicting the metabolic incorporation of AzCho into cho-phospholipids and subsequent detection of labeled membranes using copper-free click chemistry. (b) AzCho-labeled HeLa cells imaged by fluorescence (left) and transmitted light imaged before (middle) and after (right) DAB photooxidation. (c) AzCho-labeled HeLa cells imaged by white light following DAB photooxidation and OsO4 staining. The blue dotted line indicates the area of illumination. (d) TEM micrograph of an AzCho labeled HeLa cell following DAB photooxidation and osmium staining. (e) A high magnification TEM image showing the detailed features of AzCho-labeled mitochondria, including sites of ER:mitochondria contacts (black arrowheads).
Figure 5
Figure 5. Click-EM imaging of PG in L. monocytogenes
(a) Structure of AlkDAla. (b) Schematic depicting extracellular (black arrows) and intracellular (blue arrows) routes of D-amino acid incorporation into L. monocytogenes PG. (c) TEM of images of AlkDAla-labeled L. monocytogenes cells. A non-photooxidized control cell (left) is shown beside a photooxidized cell (right) for comparison. (d) High magnification TEM of a photooxidized dividing ΔPBP5 mutant cell showing labeled extracellular PG as a thick and continuous outline of contrast. Stained intracellular precursors (IP) are depicted as a continuous contour on the cytoplasmic side of the plasma membrane (PM). The PM is embedded between stained extracellular and intracellular bands and appears as region of decreased contrast.
Figure 6
Figure 6. Click-EM imaging of wild type and ramoplanin-treated L. monocytogenes
(a) Schematic depicting the expected staining pattern of AlkDAla-labeled wild type L. monocytogenes cells (top). AlkDAla is removed along the cell length by the endogenous PBP5, resulting in polar staining of extracellular PG (black arrowheads); labeled intracellular precursors are observed as a continuous contour on the cytoplasmic face of the cell membrane (red arrows). (b) Schematic depicting the expected staining pattern of ramplanin-treated wild type L. monocytogenes cells (top). Ramoplanin inhibits the transglycosylation step of PG synthesis and prevents incorporation of AlkDAla-containing disaccharide-pentapeptide monomers into the extracellular PG mesh. Labeling of extracellular PG is not detected on drug-treated cells (white arrowheads), while labeled intracellular precursors remained visible (red arrows).

References

    1. Stirling JW. Immuno- and Affinity Probes for Electron Microscopy: A Review of Labeling and Preparation Techniques. J Histochem Cytochem. 1990;48:147–157. - PubMed
    1. Deernick TJ, et al. Fluorescence photooxidation with eosin: a method for high resolution immunolocalization and in situ hybridization detection for light and electron microscopy. J Cell Biol. 1994;126:901–910. - PMC - PubMed
    1. Shu X, et al. A Genetically Encoded Tag for Correlated Light and Electron Microscopy of Intact Cells, Tissues, and Organisms. PLoS Biology. 2011;9:e1001041. - PMC - PubMed
    1. Gaietta G, et al. Multicolor and electron microscopic imaging of connexin trafficking. Science. 2002;296:503–507. - PubMed
    1. Martell JD, et al. Engineered ascorbate peroxidase as a genetically encoded reporter for electron microscopy. Nat Biotechnol. 2012;20:1143–1148. - PMC - PubMed

Publication types

MeSH terms