

Correction for Inhibition Leads to an Allosteric Co-Agonist Model for Pentobarbital Modulation and Activation of α1β3γ2L GABAA Receptors
- PMID: 27110714
- PMCID: PMC4844112
- DOI: 10.1371/journal.pone.0154031
Correction for Inhibition Leads to an Allosteric Co-Agonist Model for Pentobarbital Modulation and Activation of α1β3γ2L GABAA Receptors
Abstract
Background: Pentobarbital, like propofol and etomidate, produces important general anesthetic effects through GABAA receptors. Photolabeling also indicates that pentobarbital binds to some of the same sites where propofol and etomidate act. Quantitative allosteric co-agonist models for propofol and etomidate account for modulatory and agonist effects in GABAA receptors and have proven valuable in establishing drug site characteristics and for functional analysis of mutants. We therefore sought to establish an allosteric co-agonist model for pentobarbital activation and modulation of α1β3γ2L receptors, using a novel approach to first correct pentobarbital activation data for inhibitory effects in the same concentration range.
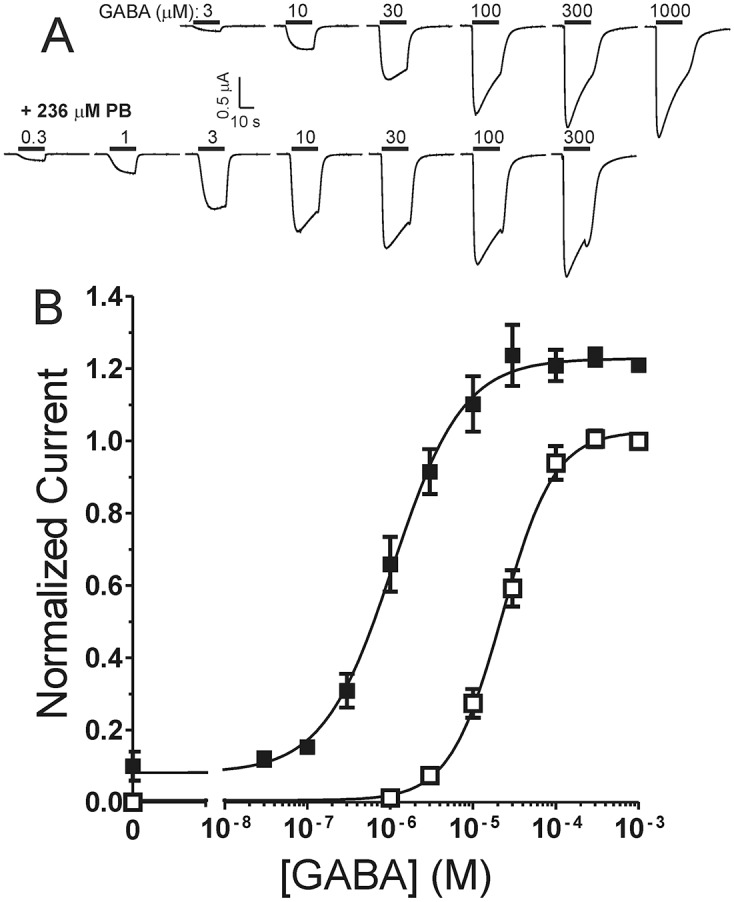
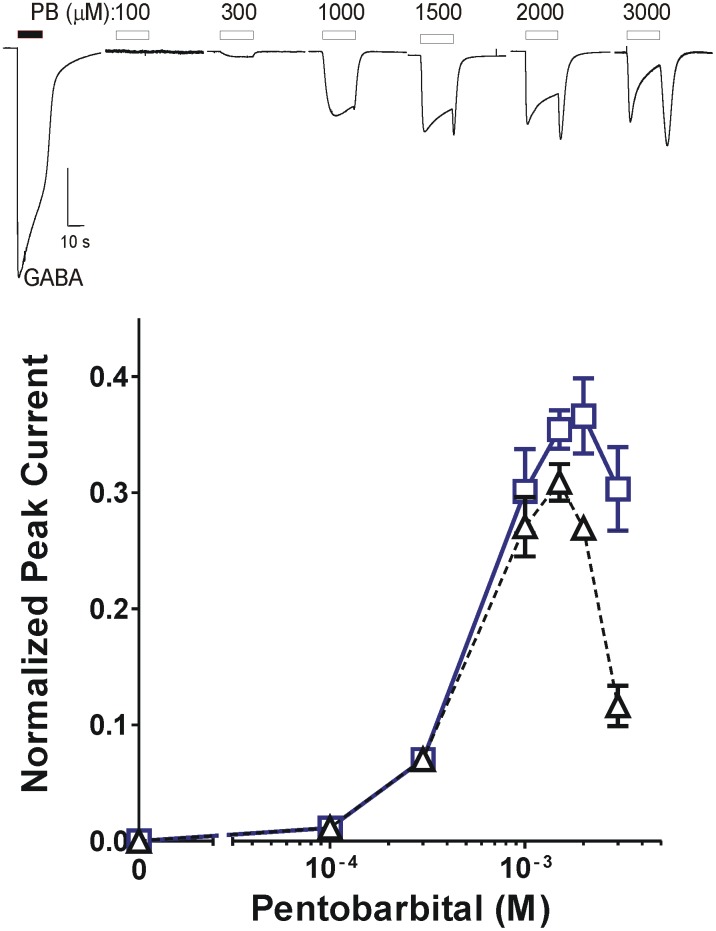
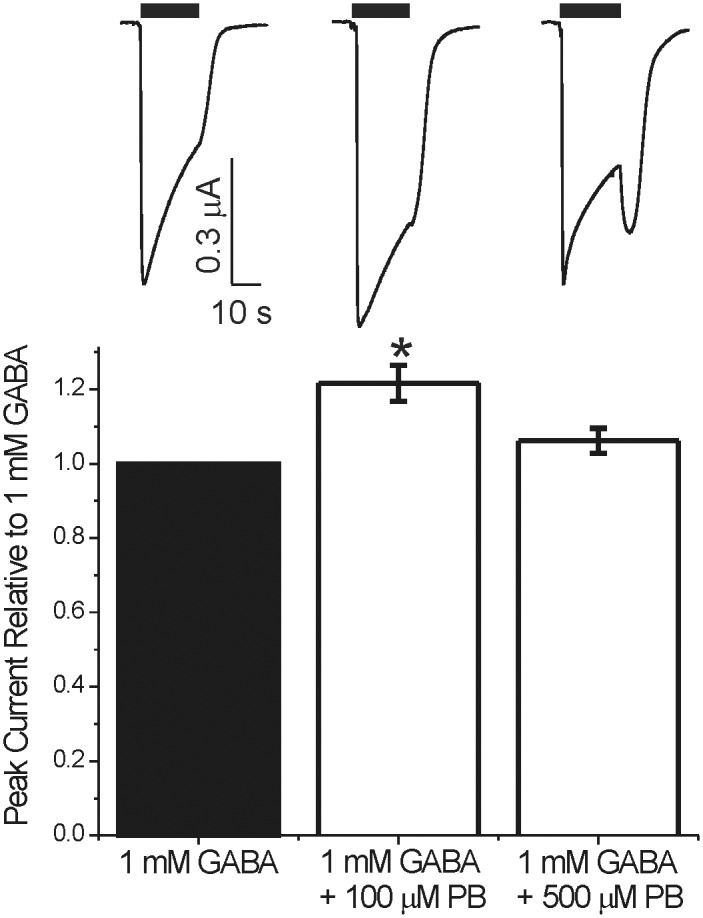
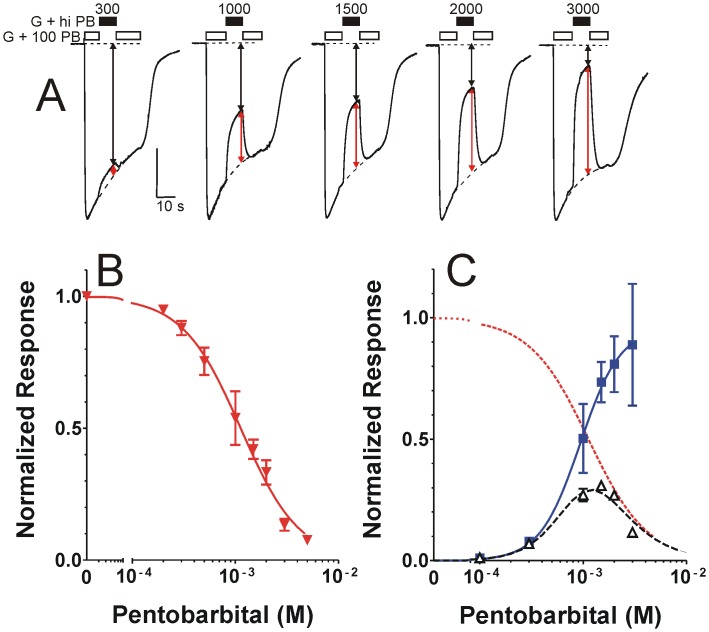
Methods: Using oocyte-expressed α1β3γ2L GABAA receptors and two-microelectrode voltage-clamp, we quantified modulation of GABA responses by a low pentobarbital concentration and direct effects of high pentobarbital concentrations, the latter displaying mixed agonist and inhibitory effects. We then isolated and quantified pentobarbital inhibition in activated receptors using a novel single-sweep "notch" approach, and used these results to correct steady-state direct activation for inhibition.
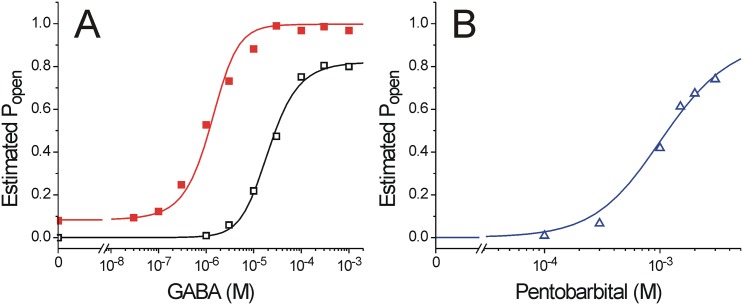
Results: Combining results for GABA modulation and corrected direct activation, we estimated receptor open probability and optimized parameters for a Monod-Wyman-Changeux allosteric co-agonist model. Inhibition by pentobarbital was consistent with two sites with IC50s near 1 mM, while co-agonist model parameters suggest two allosteric pentobarbital agonist sites characterized by KPB ≈ 5 mM and high efficacy. The results also indicate that pentobarbital may be a more efficacious agonist than GABA.
Conclusions: Our novel approach to quantifying both inhibitory and co-agonist effects of pentobarbital provides a basis for future structure-function analyses of GABAA receptor mutations in putative pentobarbital binding sites.
Conflict of interest statement
Figures
Similar articles
-
The interaction of general anaesthetics with recombinant GABAA and glycine receptors expressed in Xenopus laevis oocytes: a comparative study.Br J Pharmacol. 1997 Dec;122(8):1707-19. doi: 10.1038/sj.bjp.0701563. Br J Pharmacol. 1997. PMID: 9422818 Free PMC article.
-
An allosteric coagonist model for propofol effects on α1β2γ2L γ-aminobutyric acid type A receptors.Anesthesiology. 2012 Jan;116(1):47-55. doi: 10.1097/ALN.0b013e31823d0c36. Anesthesiology. 2012. PMID: 22104494 Free PMC article.
-
Monod-Wyman-Changeux Allosteric Shift Analysis in Mutant α1β3γ2L GABAA Receptors Indicates Selectivity and Crosstalk among Intersubunit Transmembrane Anesthetic Sites.Mol Pharmacol. 2019 Apr;95(4):408-417. doi: 10.1124/mol.118.115048. Epub 2019 Jan 29. Mol Pharmacol. 2019. PMID: 30696720 Free PMC article.
-
Monod-Wyman-Changeux allosteric mechanisms of action and the pharmacology of etomidate.Curr Opin Anaesthesiol. 2012 Aug;25(4):411-8. doi: 10.1097/ACO.0b013e328354feea. Curr Opin Anaesthesiol. 2012. PMID: 22614249 Free PMC article. Review.
-
Applying the Monod-Wyman-Changeux Allosteric Activation Model to Pseudo-Steady-State Responses from GABAA Receptors.Mol Pharmacol. 2019 Jan;95(1):106-119. doi: 10.1124/mol.118.113787. Epub 2018 Oct 17. Mol Pharmacol. 2019. PMID: 30333132 Free PMC article. Review.
Cited by
-
Combining Mutations and Electrophysiology to Map Anesthetic Sites on Ligand-Gated Ion Channels.Methods Enzymol. 2018;602:369-389. doi: 10.1016/bs.mie.2018.01.014. Epub 2018 Feb 28. Methods Enzymol. 2018. PMID: 29588039 Free PMC article. Review.
-
A chimeric prokaryotic-eukaryotic pentameric ligand gated ion channel reveals interactions between the extracellular and transmembrane domains shape neurosteroid modulation.Neuropharmacology. 2017 Oct;125:343-352. doi: 10.1016/j.neuropharm.2017.08.007. Epub 2017 Aug 10. Neuropharmacology. 2017. PMID: 28803966 Free PMC article.
-
Molecular and Regulatory Mechanisms of Desensitization and Resensitization of GABAA Receptors with a Special Reference to Propofol/Barbiturate.Int J Mol Sci. 2020 Jan 15;21(2):563. doi: 10.3390/ijms21020563. Int J Mol Sci. 2020. PMID: 31952324 Free PMC article. Review.
-
The Actions of Drug Combinations on the GABAA Receptor Manifest as Curvilinear Isoboles of Additivity.Mol Pharmacol. 2017 Nov;92(5):556-563. doi: 10.1124/mol.117.109595. Epub 2017 Aug 8. Mol Pharmacol. 2017. PMID: 28790148 Free PMC article.
-
Steady-State Activation and Modulation of the Concatemeric α1β2γ2L GABAA Receptor.Mol Pharmacol. 2019 Sep;96(3):320-329. doi: 10.1124/mol.119.116913. Epub 2019 Jul 1. Mol Pharmacol. 2019. PMID: 31263018 Free PMC article.
References
-
- Zeller A, Arras M, Jurd R, Rudolph U (2007) Identification of a molecular target mediating the general anesthetic actions of pentobarbital. Mol Pharmacol 71: 852–859. - PubMed
-
- Baumann SW, Baur R, Sigel E (2002) Forced subunit assembly in alpha1beta2gamma2 GABAA receptors. Insight into the absolute arrangement. J Biol Chem 277: 46020–46025. - PubMed
Publication types
MeSH terms
Substances
Grants and funding
LinkOut - more resources
Full Text Sources
Other Literature Sources
