. 2016 Jun;48(6):687-93.
doi: 10.1038/ng.3555. Epub 2016 Apr 25.

Concerted genomic targeting of H3K27 demethylase REF6 and chromatin-remodeling ATPase BRM in Arabidopsis

Affiliations

Concerted genomic targeting of H3K27 demethylase REF6 and chromatin-remodeling ATPase BRM in Arabidopsis

Chenlong Li et al. Nat Genet. 2016 Jun.

Abstract

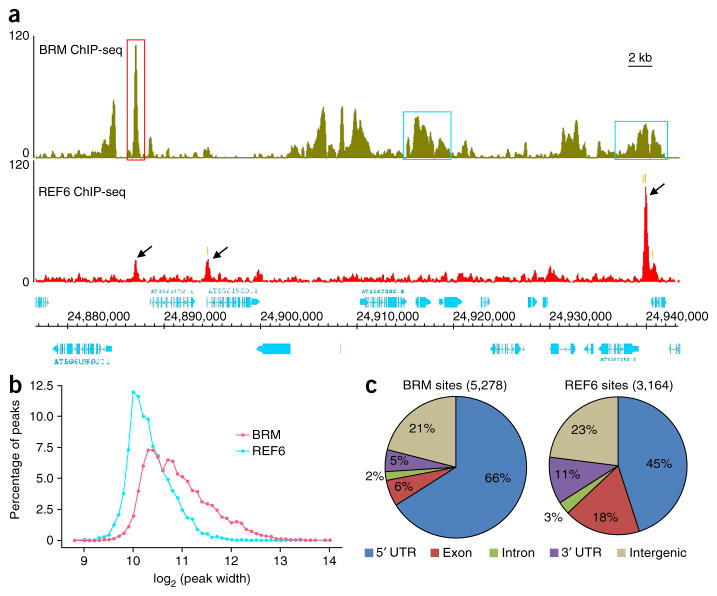
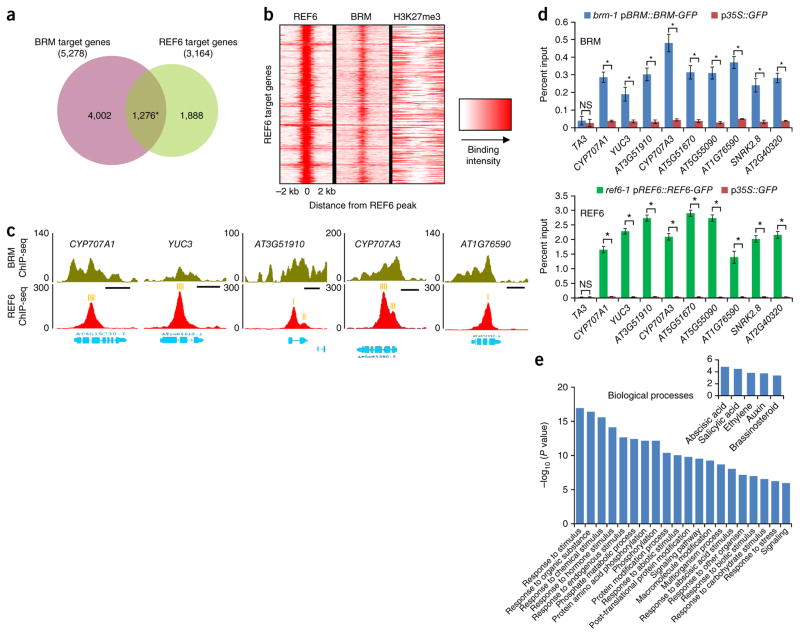
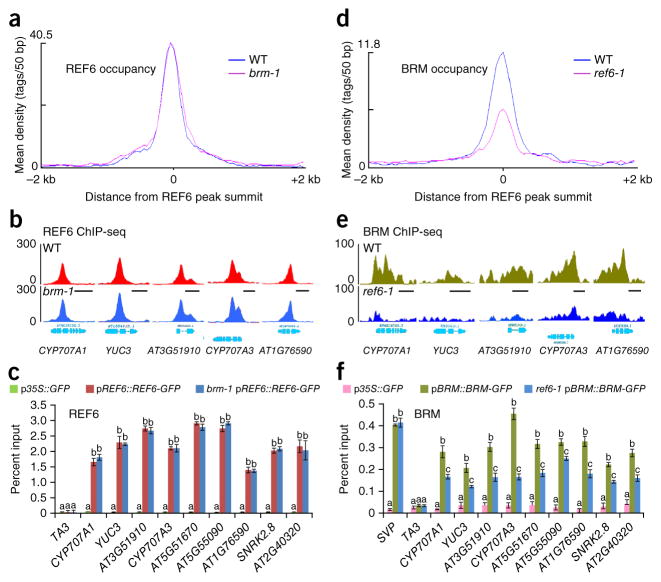
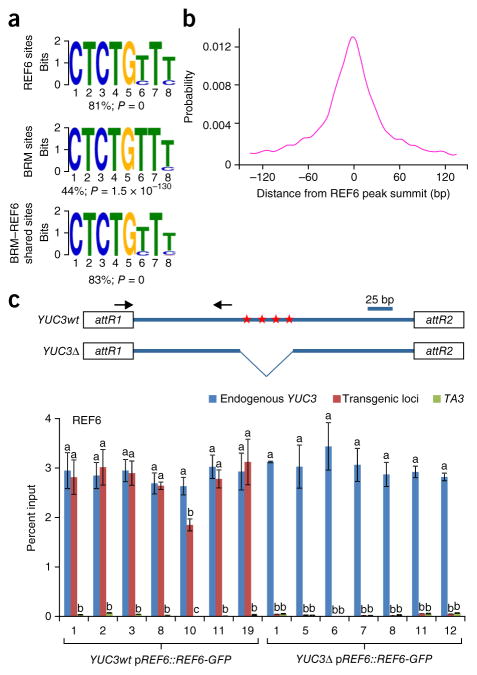
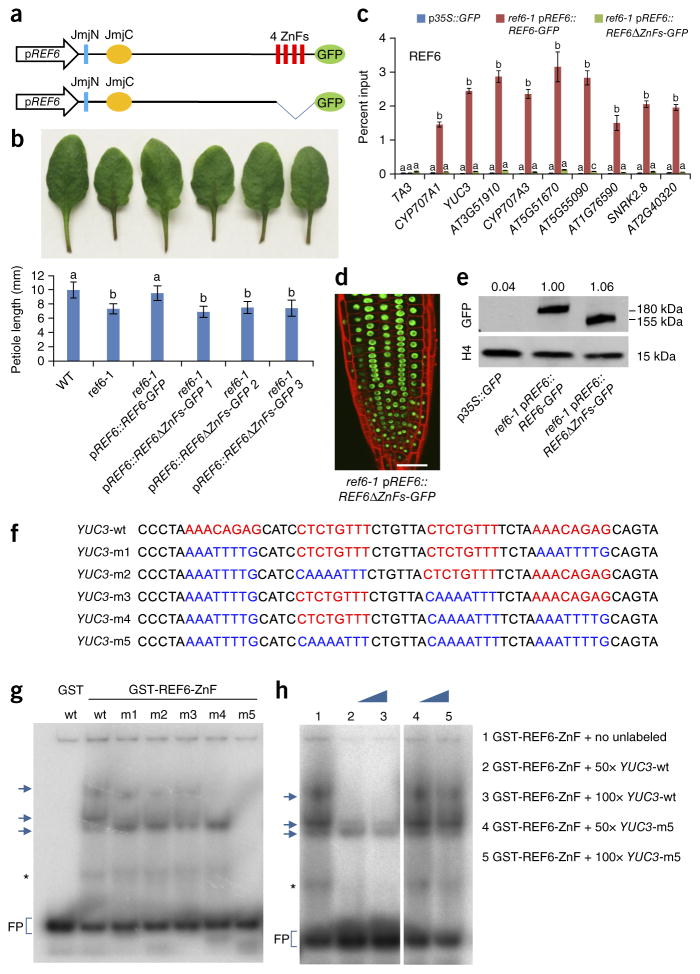
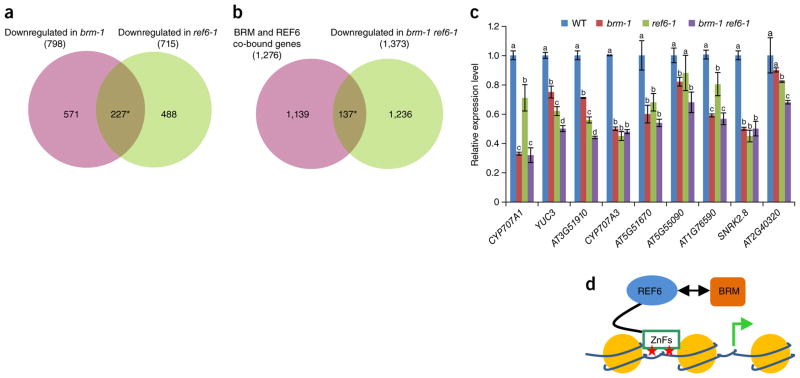
SWI/SNF-type chromatin remodelers, such as BRAHMA (BRM), and H3K27 demethylases both have active roles in regulating gene expression at the chromatin level, but how they are recruited to specific genomic sites remains largely unknown. Here we show that RELATIVE OF EARLY FLOWERING 6 (REF6), a plant-unique H3K27 demethylase, targets genomic loci containing a CTCTGYTY motif via its zinc-finger (ZnF) domains and facilitates the recruitment of BRM. Genome-wide analyses showed that REF6 colocalizes with BRM at many genomic sites with the CTCTGYTY motif. Loss of REF6 results in decreased BRM occupancy at BRM-REF6 co-targets. Furthermore, REF6 directly binds to the CTCTGYTY motif in vitro, and deletion of the motif from a target gene renders it inaccessible to REF6 in vivo. Finally, we show that, when its ZnF domains are deleted, REF6 loses its genomic targeting ability. Thus, our work identifies a new genomic targeting mechanism for an H3K27 demethylase and demonstrates its key role in recruiting the BRM chromatin remodeler.


Conflict of interest statement

The authors declare no competing financial interests.

Figures

Figure 1
Figure 1
Genome-wide occupancy of BRM and REF6. (a) ChIP-seq genome browser views of occupancy of BRM (top) and REF6 (bottom) at the same genomic coordinates on chromosome 5. The red box highlights a single, defined BRM peak, and the blue boxes highlight broad BRM peaks. Black arrows mark REF6 peaks. The positions of the CTCTGYTY motifs underlying the REF6 peaks (Fig. 4) are indicated by orange vertical bars. Gene structures are shown underneath the panel. The y-axis scales represent shifted merged MACS tag counts for every 10-bp window. (b) The average peak widths of BRM and REF6 sites. The x axis shows log2-transformed values for peak width. The y axis shows the percentage of peaks with a specific width. (c) Pie charts showing the distribution of BRM and REF6 at annotated genic and intergenic regions in the genome.
Figure 2
Figure 2
BRM and REF6 co-occupy a large number of genomic regions. (a) A Venn diagram displaying a statistically significant overlap between genes occupied by BRM and those occupied by REF6 (1,276 genes; *P < 7 × 10−162, hypergeometric test). (b) Heat map representation of the co-occupancy of BRM and REF6 in the genome. Each horizontal line represents a REF6-bound region, and signal intensity is shown for REF6 binding (left), BRM binding (middle), and H3K27me3 (right). Columns show the genomic region surrounding each REF6 peak summit. Signal intensity is indicated by the shade of red. (c) ChIP-seq genome browser views of BRM and REF6 co-occupancy at selected genes. Gene structures are shown underneath each panel. The positions of the CTCTGYTY motifs underlying the REF6 peaks (Fig. 4) are indicated by orange vertical bars. Scale bars (black), 1 kb. (d) ChIP–qPCR validation of BRM (top) and REF6 (bottom) occupancy at shared targets using ChIP DNA samples independent from those used for ChIP-seq. Data are shown as percentage of input. p35S::GFP plants were used as the negative-control sample, and the TA3 locus was used as the negative-control locus. Error bars, s.d. from three biological replicates. *P < 0.01; NS, not significant. (e) Gene Ontology (GO) analysis of the BRM–REF6 co-target genes showing that BRM and REF6 co-regulate a large number of genes involved in responses to stress. Inset, genes involved in plant responses to hormones are highly enriched.
Figure 3
Figure 3
REF6-dependent recruitment of BRM to genomic loci. (a) Mean density of REF6 occupancy at all REF6-associated sites in brm-1 plants as compared to plants with wild-type BRM (WT). The average REF6 binding signal within 2-kb genomic regions flanking the center of the REF6 peaks is shown. (b) ChIP-seq genome browser views of REF6 occupancy at selected loci in brm-1 plants and those with wild-type BRM. Gene structures are shown underneath each panel. (c) REF6 occupancy at selected genes as determined by ChIP–qPCR in brm-1 pREF6::REF6-GFP and pREF6::REF6-GFP plants. ChIP signals are shown as percentage of input. TA3 was used as a negative-control locus. Error bars, s.d. from three biological replicates. Lowercase letters indicate significant differences between genetic backgrounds, as determined by the post hoc Tukey’s HSD test. (d) Mean density of BRM occupancy at all REF6-associated sites in REF6-1 plants as compared to those with wild-type REF6 (WT). The average BRM binding signal within 2-kb genomic regions flanking the center of the REF6 peaks is shown. (e) ChIP-seq genome browser views of BRM occupancy in REF6-1 plants and those with wild-type REF6. (f) Decreased BRM occupancy at selected genes in REF6-1 pBRM::BRM-GFP plants as compared to pBRM::BRM-GFP plants as determined by ChIP–qPCR. SVP, a BRM target gene showing no difference in BRM occupancy between the two backgrounds in ChIP-seq analysis, was also included as a control. Error bars, s.d. from three biological replicates. Lowercase letters indicate significant differences between genetic backgrounds, as determined by the post hoc Tukey’s HSD test.
Figure 4
Figure 4
A DNA motif required for REF6 genomic targeting. (a) The CTCTGYTY motif is present in REF6 and BRM targets and in BRM–REF6 co-targets. MEME-ChIP was used for de novo motif discovery. The percentage of peaks containing the motif is shown. P values were determined by MEME-ChIP. (b) Distribution of the CTCTGYTY motif across REF6 peaks. (c) The CTCTGYTY motif is necessary for the recruitment of REF6. Shown at the top is a schematic of the transgene constructs derived from the YUC3 gene. Red stars indicate the positions of the CTCTGTTT sequences; attR1 and attR2 are recombination sites in the Gateway-compatible vector. For the full sequence of the transgene, see Supplementary Figure 9. At the bottom are ChIP–qPCR results showing that REF6 binds the transgene containing the wild-type motifs (YUC3wt) but not the transgene without the motifs (YUC3Δ). Seven independent transgenic lines were analyzed for each construct. ChIP signals are shown as percentage of input. The endogenous YUC3 locus and the TA3 locus were used as positive and negative controls, respectively. Error bars, s.d. from three biological replicates. Lowercase letters indicate significant differences between genetic backgrounds, as determined by the post hoc Tukey’s HSD test.
Figure 5
Figure 5
The REF6 zinc-finger domains are essential for the binding of REF6 to chromatin. (a) A schematic of the proteins encoded by the transgene constructs. The conserved domains of REF6 are shown. (b) Image of petioles (top) and quantification of the petiole length (bottom) in plants with the different genotypes. Error bars, s.d. from 17 plants. Lowercase letters indicate significant differences between genetic backgrounds, as determined by the post hoc Tukey’s HSD test. (c) ChIP–qPCR results showing genomic occupancy by the wild-type and ZnF-deleted REF6-GFP fusion proteins. p35S::GFP was used as the negative-control transgene, and the TA3 locus was used as the negative-control locus. Error bars, s.d. from three biological replicates. (d) Confocal image of root tips showing nuclear localization of the REF6ΔZnFs-GFP fusion protein. Red fluorescent signal is from propidium iodide staining. Scale bar, 20 μm. (e) Immunoblot analyses showing the relative protein levels of REF6-GFP and REF6ΔZnFs-GFP (numbers at the top represent amounts normalized to the loading control, histone H4). (f) Sequences of the DNA probes used in the EMSAs. Wild-type and mutated sequences are shown in red and blue, respectively. (g) EMSA showing that GST-REF6-ZnF but not GST by itself specifically binds the YUC3-wt, YUC3-m1, YUC3-m2, YUC3-m3, and YUC3-m4 probes but not the YUC3-m5 probe. Arrows indicate the shifted bands. FP, free probe. The asterisk indicates a band likely corresponding to degraded GST-REF6-ZnF. (h) The addition of excess unlabeled wild-type probe (lanes 2 and 3) but not YUC3-m5 mutant probe (lanes 4 and 5) outcompetes the strong interactions visible in lane 1. The uncropped scan is shown in Supplementary Data 6.
Figure 6
Figure 6
Expression of BRM–REF6 co-target genes in the brm-1, REF6-1, and brm-1 REF6-1 backgrounds. (a,b) Venn diagrams showing statistically significant overlaps between genes downregulated in both brm-1 and REF6-1 (*P = 5.5 × 10−185) (a) and between BRM–REF6 co-bound genes and genes downregulated in brm-1 REF6-1 (*P = 5.8 × 10⁻²¹) (b). (c) qRT–PCR analyses showing decreased expression of selected genes in brm-1, REF6-1, and brm-1 REF6-1 plants as compared with wild-type plants. The expression level of each gene was normalized to that of GAPDH. Error bars, s.d. from three biological replicates. Lowercase letters indicate significant differences between genetic backgrounds, as determined by the post hoc Tukey’s HSD test. (d) A proposed model showing that REF6 directly binds to chromatin DNA containing CTCTGYTY motifs (red stars) via its ZnF domains and subsequently facilitates the recruitment of BRM, predominantly resulting in activation of gene expression.

Comment in

References

    1. Van der Meulen J, Speleman F, Van Vlierberghe P. The H3K27me3 demethylase UTX in normal development and disease. Epigenetics. 2014;9:658–668. - PMC - PubMed
    1. Hargreaves DC, Crabtree GR. ATP-dependent chromatin remodeling: genetics, genomics and mechanisms. Cell Res. 2011;21:396–420. - PMC - PubMed
    1. Ho L, Crabtree GR. Chromatin remodelling during development. Nature. 2010;463:474–484. - PMC - PubMed
    1. Clapier CR, Cairns BR. The biology of chromatin remodeling complexes. Annu Rev Biochem. 2009;78:273–304. - PubMed
    1. Kooistra SM, Helin K. Molecular mechanisms and potential functions of histone demethylases. Nat Rev Mol Cell Biol. 2012;13:297–311. - PubMed

Publication types

MeSH terms