. 2016 Jun;17(6):695-703.
doi: 10.1038/ni.3456. Epub 2016 Apr 25.

Tcf1 and Lef1 transcription factors establish CD8(+) T cell identity through intrinsic HDAC activity

Affiliations

Tcf1 and Lef1 transcription factors establish CD8(+) T cell identity through intrinsic HDAC activity

Shaojun Xing et al. Nat Immunol. 2016 Jun.

Abstract

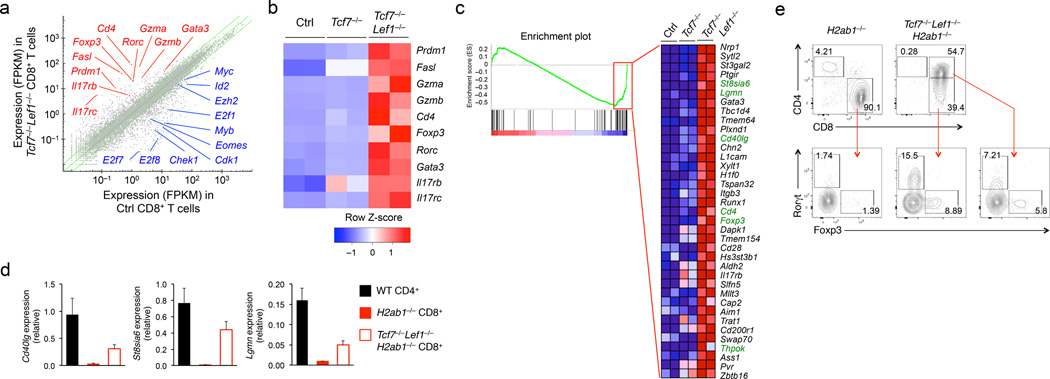
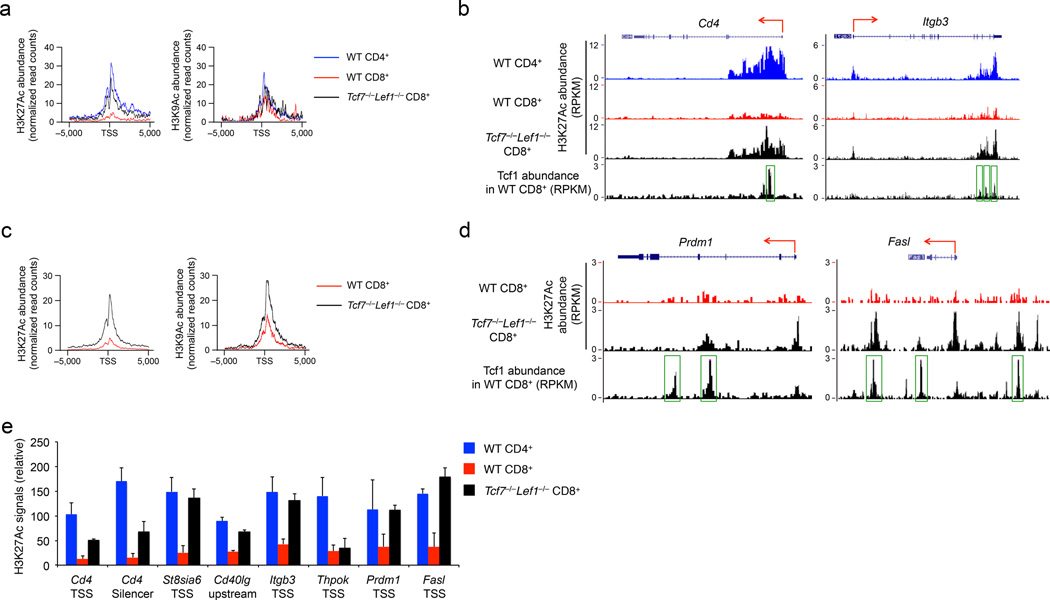
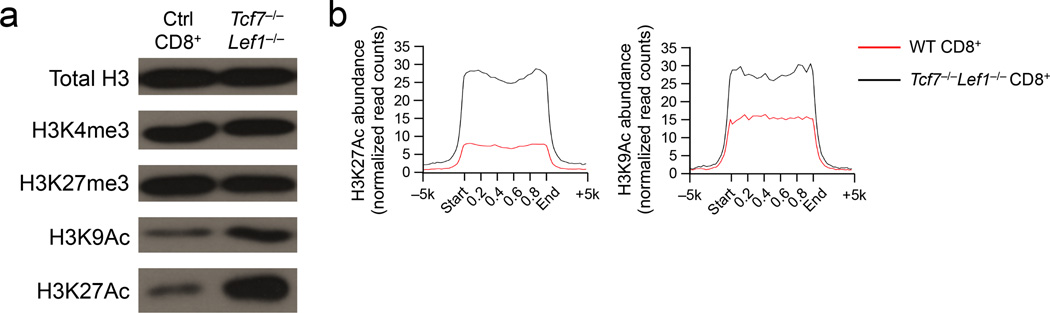
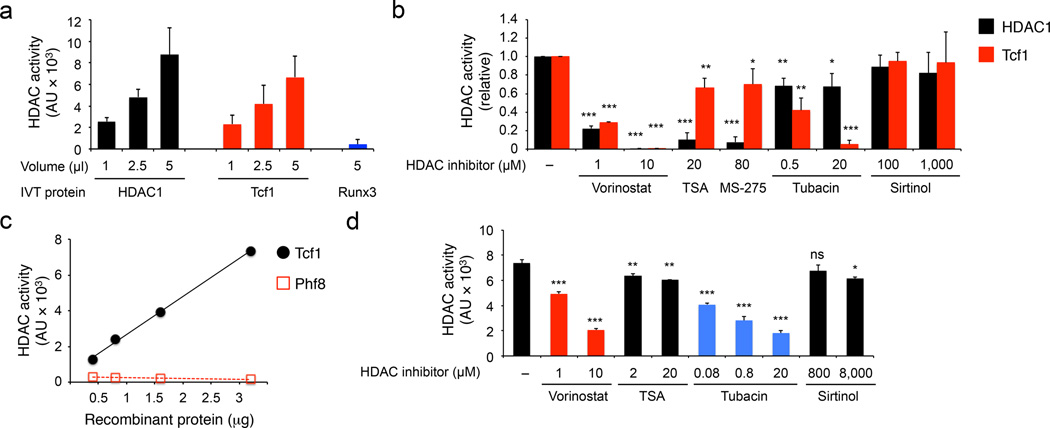
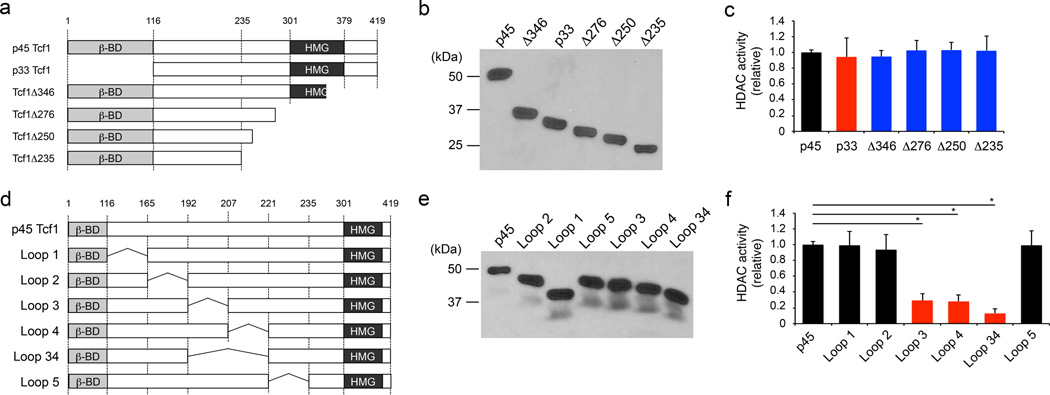
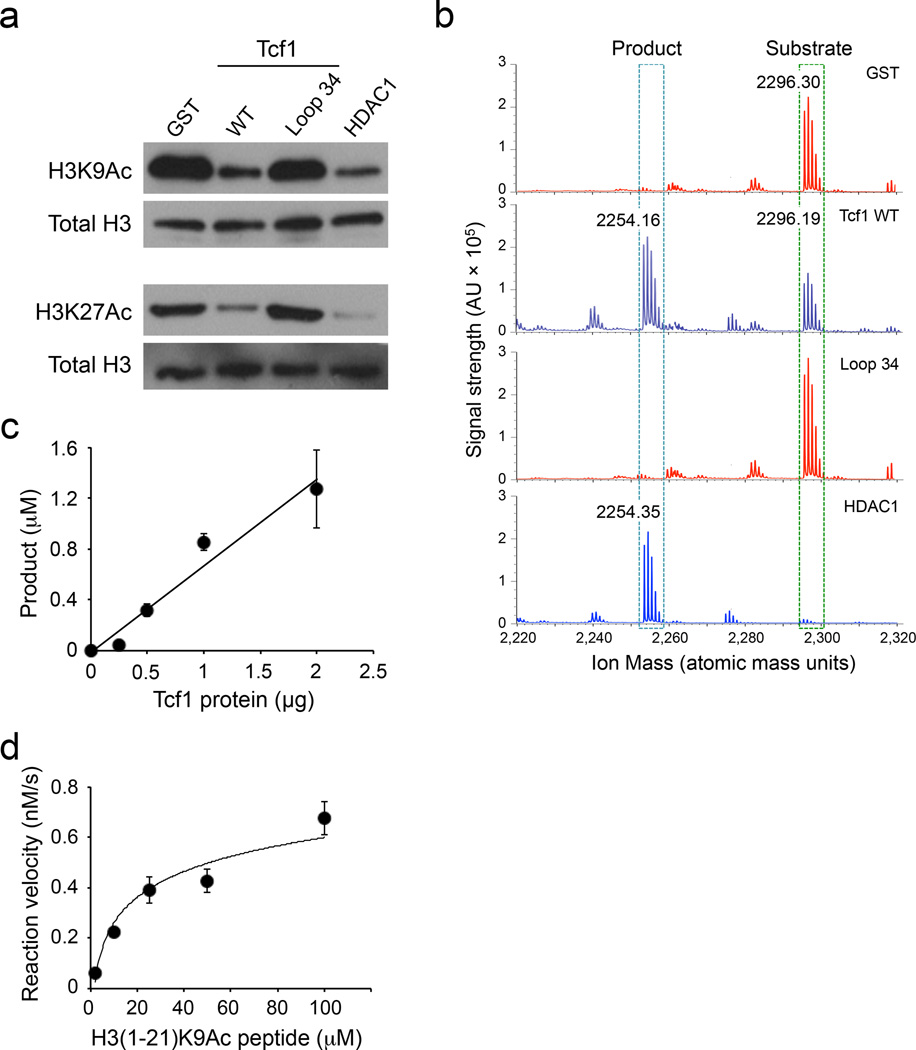
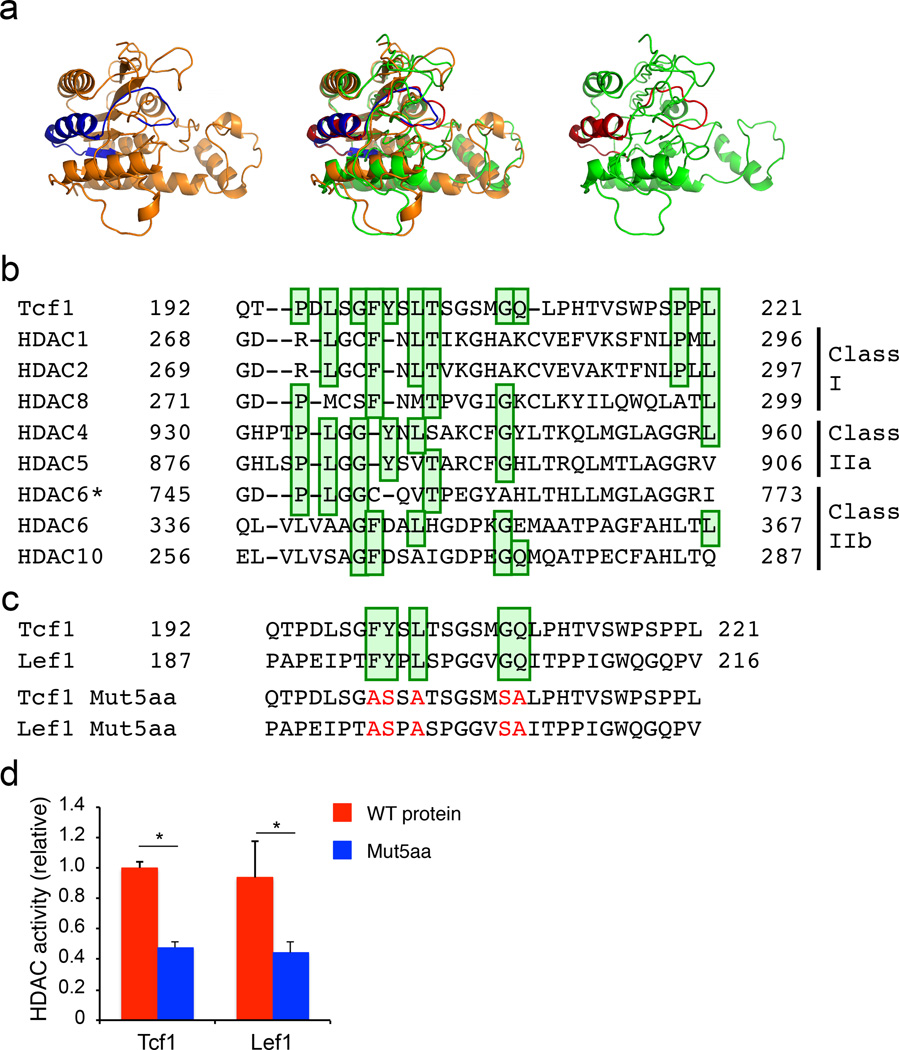
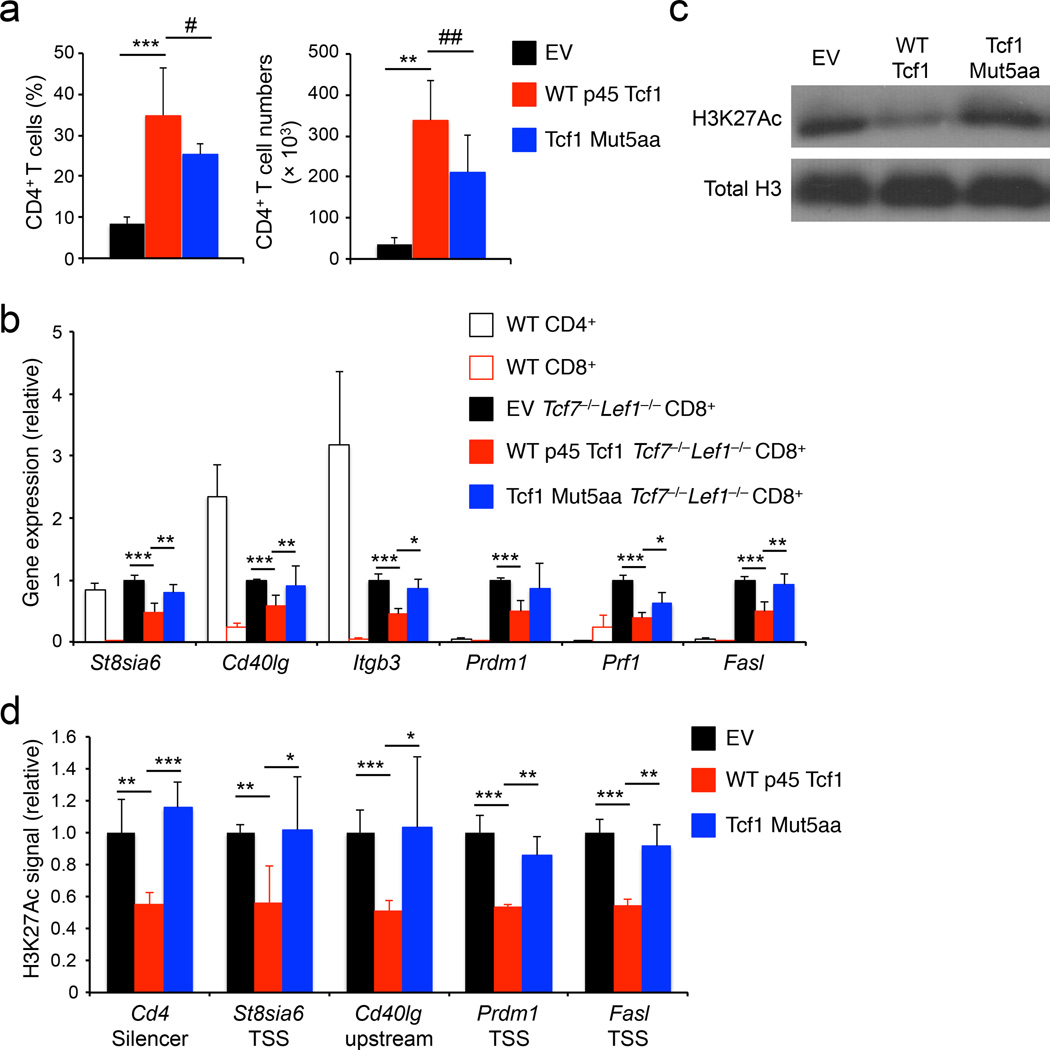
The CD4(+) and CD8(+) T cell dichotomy is essential for effective cellular immunity. How individual T cell identity is established remains poorly understood. Here we show that the high-mobility group (HMG) transcription factors Tcf1 and Lef1 are essential for repressing CD4(+) lineage-associated genes including Cd4, Foxp3 and Rorc in CD8(+) T cells. Tcf1- and Lef1-deficient CD8(+) T cells exhibit histone hyperacetylation, which can be ascribed to intrinsic histone deacetylase (HDAC) activity in Tcf1 and Lef1. Mutation of five conserved amino acids in the Tcf1 HDAC domain diminishes HDAC activity and the ability to suppress CD4(+) lineage genes in CD8(+) T cells. These findings reveal that sequence-specific transcription factors can utilize intrinsic HDAC activity to guard cell identity by repressing lineage-inappropriate genes.


Figures

Figure 1
Figure 1. Tcf1 and Lef1 deficiency perturbs CD8+ T cell integrity
(a) RNA-Seq analysis of genes upregulated (red) or downregulated (blue) in TCRβhiCD24CD69CD8+ mature thymocytes sorted from Tcf7−/−Tcf7−/−Lef1−/−, and control littermates, with the average FPKM values of two replicates of control (Ctrl) vs. Tcf7−/−Lef1−/− CD8+ T cells shown in a scatterplot, where the green lines denote gene expression changes of ≥2 fold. (b) Select upregulated genes (right margin) in Tcf7−/−Lef1−/−CD8+ mature thymocytes relative to control and Tcf7−/− CD8+ thymocytes as shown in a heatmap. (c) GSEA showing enriched expression of genes in the CD4+ T cell gene set in Tcf7−/−Lef1−/− CD8+ mature thymocytes, with the enriched genes (red rectangle in the enrichment plot) displayed in a heatmap, where CD4+ signature genes are highlighted in green. (d) Quantitative RT-PCR analysis of Cd40lg, St8sia6 and Lgmn expression (relative the Hprt housekeeping gene) in CD4+ mature thymocytes sorted from wild-type (WT) mice, CD8+ mature thymocytes sorted from H2ab1−/− or Tcf7−/−Lef1−/−H2ab1−/− mice. (e) Intracellular staining for Foxp3 and Rorγt proteins in CD8+ mature thymocytes in H2ab1−/− mice, CD8+CD4 and CD8+CD4+ thymocytes in Tcf7−/−Lef1−/−H2ab1−/− mice. Numbers adjacent to outlined areas indicate percent Foxp3+ and Rorγt+ cells in lower panels. Data are from one experiment measuring duplicate samples (a-c), from 2 experiments (d, means ± s.d., n ≥ 4), or representative of ≥ 5 experiments (e).
Figure 2
Figure 2. Tcf7−/− Lef1−/− CD8+ T cells exhibit histone hyperacetylation
(a) ChIP-Seq analysis of H3K27Ac and H3K9Ac histone marks in CD4+ or CD8+ mature thymocytes sorted from wild-type (WT) mice or CD8+ mature thymocytes sorted from Tcf7−/−Lef1−/− mice, with H3K27Ac and H3K9Ac profiles (normalize read counts) shown at the “−5 kb to +5 kb” regions flanking the TSSs of 108 genes in the CD4+ T cell gene set. (b) H3K27Ac ChIP-Seq tracks at the Cd4 and Itgb3 gene loci in WT CD4+, WT or Tcf7−/−Lef1−/− CD8+ mature thymocytes (marked on top of the panels are the gene structures and transcriptional orientations), along with Tcf1 ChIP-Seq tracks in splenic CD8+ T cells, where MACS-called Tcf1 binding peaks are marked by green rectangles. (c) H3K27Ac and H3K9Ac profiles (normalize read counts) at the “−5 kb to +5 kb” regions flanking the TSSs of 472 upregulated genes in Tcf7−/−Lef1−/− CD8+ mature thymocytes. (d) H3K27Ac ChIP-seq tracks at the Prdm1 and Fasl gene loci in WT and Tcf7−/−Lef1−/− CD8+ mature thymocytes, along with Tcf1 ChIP-Seq tracks in splenic CD8+ T cells. (e) ChIP-qPCR analysis of relative H3K27Ac signals (ChIP with H3K27Ac antibody normalized to ChIP with IgG) at the indicated genomic locations in splenic WT CD4+, WT or Tcf7−/−Lef1−/− CD8+ T cells. Data are from one experiment (a-d), or from 2 experiments with each sample measured in duplicate (e, means ± s.d.).
Figure 3
Figure 3. Tcf1 is connected with histone acetylation status in CD8+ T cells
(a) Immunoblot analysis of total or modified H3 histones in histone protein extracted from splenic CD8+ T cells sorted from Tcf7−/−Lef1−/− or control littermates. (b) H3K27Ac and H3K9Ac profiles (normalize read counts) of wild-type (WT) and Tcf7−/−Lef1−/− CD8+ mature thymocytes within and outside the 7,807 high-confidence Tcf1 binding sites identified by Tcf1 ChIP-Seq analysis in splenic CD8+ T cells. Data are representative of two experiments (a), or from one experiment (b).
Figure 4
Figure 4. Tcf1 has intrinsic HDAC activity
(a) Deacetylation assay using IVT HDAC1, Tcf1 or Runx3. AU, arbitrary unit. (b) Deacetylation assay of IVT HDAC1 and Tcf1 in the presence of various HDAC inhibitors at indicated concentrations, with the activity of untreated HDAC1 or Tcf1 set as 1 and the relative activity of inhibitor-treated proteins normalized accordingly. (c) Deacetylation assay using purified His-tagged recombinant Tcf1 or Phf8 segment at indicated protein amounts. (d) Deacetylation assay of purified recombinant Tcf1 (3.2 µg) in the presence of HDAC inhibitors. Data are from ≥ 3 experiments (a, b and d, means ± s.d.) or average from 2 experiments (c). ns, not statistically significant; *, p<0.05; **, p<0.01; and ***, p<0.001 compared with untreated proteins, by Student’s t-test.
Figure 5
Figure 5. Mapping the HDAC activity domain in Tcf1
(a) Diagram showing N- and C-terminal truncations of p45 Tcf1. (b) Immunoblot analysis of IVT FLAG-tagged Tcf1 truncated proteins with an anti-FLAG antibody. (c) Deacetylation assay using IVT Tcf1 truncated proteins, with the activity of WT p45 Tcf1 set as 1, and the relative activity of Tcf1 truncated proteins normalized accordingly. (d) Diagram showing internal deletions in p45 Tcf1. (e) Immunoblot analysis of IVT FLAG-tagged Tcf1 internal deletion mutant proteins with an anti-FLAG antibody. (f) Deacetylation assay using IVT Tcf1 internal deletion mutant proteins, with relative HDAC activities calculated as in c. Data are representative from 2 experiments (b, e), or from ≥ 3 experiments (c, f, means ± s.d.). *, p<0.001 compared with WT p45 Tcf1, by Student’s t-test.
Figure 6
Figure 6. Tcf1 catalyzes deacetylation of histone protein/peptide substrates
(a) Deacetylation of H3K9Ac and H3K27Ac protein substrates by GST, FPLC-purified WT p45 Tcf1, Tcf1 Loop34, or HDAC1, as determined by immunoblot analysis of the acetylation levels of the histone substrates. Total H3 protein was detected to show similar amounts of substrates were used in individual assays. (b) Deacetylation of H3(1–21)K9Ac peptide substrate by GST, FPLC-purified WT p45 Tcf1, Tcf1 Loop34, or HDAC1, as determined by MALDI. The acetylated peptide substrate was detected at an m/z of ~2296 Da, and the deacetylated product was detected at an m/z of ~2254 Da on MALDI spectra. (c) Analysis of dose-dependent deacetylation of the H3(1–21)K9Ac peptide by FPLC-purified WT p45 Tcf1, with the amounts of deacetylated products quantified by normalizing to a fixed amount of Angiotensin I peptide (m/z 1296.69 Da) on MALDI. (d) Kinetic analysis of deacetylation of the H3(1–21)K9Ac peptide by FPLC-purified WT p45 Tcf1. Data are representative from 2 experiments (a), or from >3 experiments (b), or from 2 experiments with 8–11 measurements of each assay point (c, d, means ± s.d.).
Figure 7
Figure 7. Homology modelling and sequence conservation predict an HDAC-like structure of Tcf1
(a) Homology modelling analysis of Tcf1 (D21-N286, right panel in green) with a partial HDAC8 structure (D73-N357, left panel in orange) as a template. The predicted Tcf1 structure and HDAC8 structure were superposed (middle panel) for stereo view. The 30-aa Tcf1 HDAC domain (Q192-L221) is colored in red, and the corresponding HDAC8 domain (G271-L299) is colored in blue. (b) Amino acid sequence alignment of Tcf1 HDAC domain with those in conventional HDACs, with the conserved amino acids highlighted in green boxes. HDAC6 is distinct from other HDACs in that it contains two HDAC domains, and alignments of the first and second domains with Tcf1 are marked as ‘HDAC6’ and ‘HDAC6*’, respectively. (c) Amino acid sequence comparison between Tcf1 and Lef1, with mutations of five conserved amino acids highlighted in red in the Tcf1 Mut5aa and Lef1 Mut5aa sequences. (d) Deacetylation assays of IVT wild-type (WT) Tcf1, Tcf1 Mut5aa, WT Lef1 and Lef1 Mut5aa proteins. Data are from 3 experiments (d, means ± s.d.). *, p<0.001 compared with WT proteins, by Student’s t-test.
Figure 8
Figure 8. The Tcf1 HDAC activity is essential for establishing CD8+ T cell identity
(a) Analysis of frequency (left) and numbers (right) of donor-derived CD45.2+GFP+TCRβ+CD4+ T cells in the spleens of BM chimeras that were reconstituted with Tcf7−/−Lef1−/− lineage-negative bond marrow cells retrovirally infected with empty vector (EV), WT p45 Tcf1, or Tcf1 Mut5aa retrovirus. (b) Quantitative RT-PCR analysis of gene expression (relative to Hprt) in wild-type (WT) splenic CD4+ or CD8+ T cells, splenic CD45.2+GFP+TCRβ+CD8+ T cells sorted from the EV-, WT p45 Tcf1-, or Tcf1 Mut5aa-complemented Tcf7−/−Lef1−/− BM chimeras. For each gene, its expression in EV-complemented cells was set as 1, and that in other cell types was normalized accordingly. (c) Immunoblot analysis of H3K27Ac and total H3 histone in histone protein extracted from splenic CD45.2+GFP+TCRβ+ CD8+ T cells sorted from the EV-, WT p45 Tcf1-, or Tcf1 Mut5aa-complemented Tcf7−/−Lef1−/− BM chimeras. (d) ChIP-qPCR analysis of relative H3K27Ac signals at select gene loci in splenic CD45.2+GFP+TCRβ+CD8+ T cells sorted from EV-, WT p45 Tcf1-, or Tcf1 Mut5aa-complemented Tcf7−/−Lef1−/− BM chimeras. For each gene locus, the relative H3K27Ac signal in EV-complemented cells was set as 1, and that in other cell types was normalized accordingly. Data are from 3 experiments (a, b, means ± s.d., n = 4–5), or representative from 3 experiments (c), or from 2 experiments with each sample measured in duplicates (d, means ± s.d.). #, p = 0.11; ##, p = 0.06; *, p<0.05; **, p<0.01; ***, p<0.001 for indicated comparisons, by Student’s t-test.

Comment in

  • Tcf1 and Lef1 pack their own HDAC.
    Ng CP, Littman DR. Ng CP, et al. Nat Immunol. 2016 May 19;17(6):615-6. doi: 10.1038/ni.3469. Nat Immunol. 2016. PMID: 27196513 Free PMC article.

References

    1. Fisher AG. Cellular identity and lineage choice. Nature reviews Immunology. 2002;2(12):977–982. - PubMed
    1. Smale ST. The establishment and maintenance of lymphocyte identity through gene silencing. Nature immunology. 2003;4(7):607–615. - PubMed
    1. Rothenberg EV, Zhang JA. T-cell identity and epigenetic memory. Current topics in microbiology and immunology. 2012;356:117–143. - PMC - PubMed
    1. Natoli G. Maintaining cell identity through global control of genomic organization. Immunity. 2010;33(1):12–24. - PubMed
    1. Kulessa H, Frampton J, Graf T. GATA-1 reprograms avian myelomonocytic cell lines into eosinophils, thromboblasts, and erythroblasts. Genes & development. 1995;9(10):1250–1262. - PubMed

References associated with Methods

    1. Li B, Dewey CN. RSEM: accurate transcript quantification from RNA-Seq data with or without a reference genome. BMC bioinformatics. 2011;12:323. - PMC - PubMed
    1. Leng N, Dawson JA, Thomson JA, Ruotti V, Rissman AI, Smits BM, et al. EBSeq: an empirical Bayes hierarchical model for inference in RNA-seq experiments. Bioinformatics. 2013;29(8):1035–1043. - PMC - PubMed
    1. Hattori N, Kawamoto H, Fujimoto S, Kuno K, Katsura Y. Involvement of transcription factors TCF-1 and GATA-3 in the initiation of the earliest step of T cell development in the thymus. J Exp Med. 1996;184(3):1137–1147. - PMC - PubMed
    1. Langmead B. Aligning short sequencing reads with Bowtie. Curr Protoc Bioinformatics. 2010 Chapter 11: Unit 11 17. - PMC - PubMed
    1. Zang C, Schones DE, Zeng C, Cui K, Zhao K, Peng W. A clustering approach for identification of enriched domains from histone modification ChIP-Seq data. Bioinformatics. 2009;25(15):1952–1958. - PMC - PubMed

Publication types

MeSH terms

Substances