. 2016 Jun;22(6):641-8.
doi: 10.1038/nm.4084. Epub 2016 Apr 25.

Interictal epileptiform discharges induce hippocampal-cortical coupling in temporal lobe epilepsy

Affiliations

Interictal epileptiform discharges induce hippocampal-cortical coupling in temporal lobe epilepsy

Jennifer N Gelinas et al. Nat Med. 2016 Jun.

Abstract

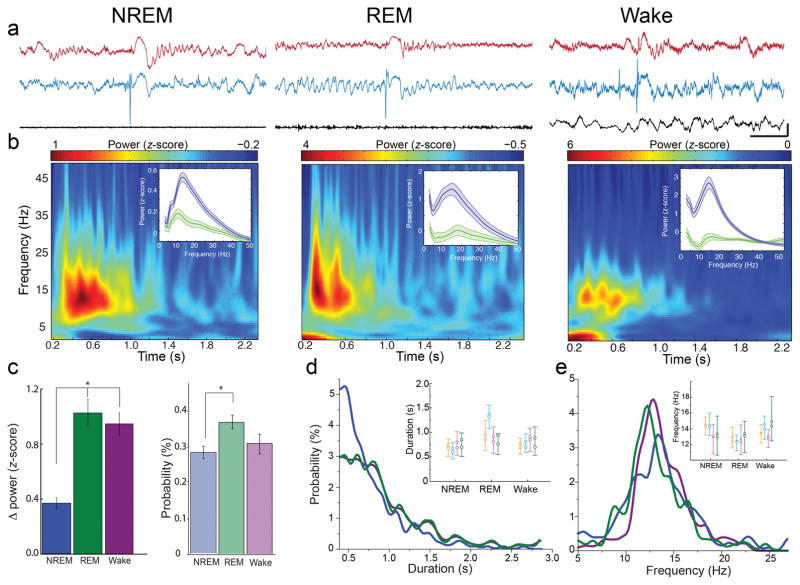
Interactions between the hippocampus and the cortex are critical for memory. Interictal epileptiform discharges (IEDs) identify epileptic brain regions and can impair memory, but the mechanisms by which they interact with physiological patterns of network activity are mostly undefined. We show in a rat model of temporal lobe epilepsy that spontaneous hippocampal IEDs correlate with impaired memory consolidation, and that they are precisely coordinated with spindle oscillations in the prefrontal cortex during nonrapid-eye-movement (NREM) sleep. This coordination surpasses the normal physiological ripple-spindle coupling and is accompanied by decreased ripple occurrence. IEDs also induce spindles during rapid-eye movement (REM) sleep and wakefulness-behavioral states that do not naturally express these oscillations-by generating a cortical 'down' state. In a pilot clinical examination of four subjects with focal epilepsy, we confirm a similar correlation of temporofrontal IEDs with spindles over anatomically restricted cortical regions. These findings imply that IEDs may impair memory via the misappropriation of physiological mechanisms for hippocampal-cortical coupling, which suggests a target for the treatment of memory impairment in epilepsy.


Conflict of interest statement

Competing Financial Interests

The authors declare no competing financial interests.

Figures

Figure 1
Figure 1
Occurrence, detection, and coupling of hippocampal and mPFC oscillations during kindling. (a) Occurrence of IEDs in NREM, REM and Wake (bars) and increase in Racine stage (line) during kindling. Error bars = Mean ± s.e.m.; n = 4 rats. (b) Raster plot of mPFC spindles (blue) and hippocampal ripples (purple; scale bar = 10 s). Sample recorded ripple (black; Or = stratum oriens, Pyr = stratum pyramidale, Rad = stratum radiatum; scale bar = 30 ms). Raw LFP of detected ripple (purple; scale bar = 100 μV, 50 ms) with filtered (100–250 Hz), rectified version (bottom left; s.d. = standard deviation). Raw LFP of detected mPFC spindle associated with ripple (blue; scale bar = 100 μV, 500 ms) alongside filtered (10–20 Hz), rectified version (bottom right). (c) Raster plot of mPFC spindles (blue) and hippocampal IEDs (orange) after 14 d of kindling (scale bar = 10 s). Averaged spectrogram of hippocampal IED (scale bar = 500 ms). Raw LFP of detected IED (orange; scale bar = 200 μV, 100 ms) with filtered (60–80 Hz), rectified version. Detected mPFC spindle evoked by IED (blue; scale bar = 100 μV, 500 ms). (d) Occurrence of ripples, spindles, and IEDs in NREM sleep over 18 d of kindling. Error bars = Mean ± s.e.m.; n = 4 rats. Occurrence of spindles has a non-significant trend toward decrease over time (Mann Kendall tau (τ) = –0.16; P = 0.065; Z-test) whereas ripples decrease significantly (τ = –0.52; P = 5 × 10⁻⁹) and IEDs increase (τ = 0.65; P = 5 × 10⁻¹²).
Figure 2
Figure 2
Hippocampal IEDs impair memory. (a) Schematic of behavioral protocol (b = baseline, k = kindling, r = recovery; a = artificial IED). (b) Sample baseline behavioral performance. Five overlaid rat trajectories (red) and consummatory periods (blue) for the last five trials of a training session on the cheeseboard maze (left) and the five trials of the corresponding test session 24 h later (right). (c) Sample behavioral performance at the end of kindling; conventions as in (b). (d) Memory performance score on test sessions across the behavioral protocol. Different colors represent scores of individual rats (n = 6 for baseline, kindle; n = 5 for recovery, a-IEDs). One rat was unable to complete the recovery and a-IEDs phases due to breakage of the hippocampal probe (Kruskal-Wallis ANOVA P = 3.6 × 10⁻¹⁰; Bonferroni correction; baseline/recovery vs. kindle P = 3.7 × 10⁻¹⁰; baseline/recovery vs. a-IED P = 9.8 × 10⁻⁴; kindle vs. a-IED P = 0.4). (e) Multivariate correlation of IED rate, IED-spindle coupling rate, ripple rate, (all in events/s) and cumulative number of seizures with memory performance score. Different colors represent correlations for individual rats (n = 5; one animal was eliminated from this statistical analysis due to inability to detect ripples throughout behavioral phases).
Figure 3
Figure 3
Correlation of hippocampal IEDs and ripples with mPFC spindles. (a) Cross-correlation of IEDs and spindles (left; n = 47 sessions from four rats; 15,441 IEDs, 37,835 spindles). Cross-correlation of ripples and spindles (right; n = 11 sessions from four rats; 19,109 ripples, 5,919 spindles; red lines = 95% confidence intervals). (b) Averaged mPFC spectrogram following hippocampal IED (top left) or ripple (top right; same power scale; scale bar = 200 ms). Averaged power spectrum (bottom; mean ± s.e.m.) before (blue) and after (green) IED or ripple. (c) Average filtered spindle waveform in unkindled rats (baseline, B, blue), spontaneous spindle in kindled rats (spontaneous, S, red), and IED-evoked spindle in kindled rats (evoked, E, green; scale bar = 100 μV, 200 ms; n = 500 spindles for each group from four rats). (d) Probability distribution of duration across spindle types. Inset: changes in mean (open circle) and median (open square) spindle duration in each rat (separate color) across spindle type (box plot tails = 25th and 75th percentiles; Kruskal-Wallis P = 1.0 × 10⁻⁷; B vs. S P = 6.4 × 10⁻⁸; S vs. E P = 0.002 (Bonferroni correction); n = 1,074 baseline spindles, 1,236 spontaneous spindles, 1,071 evoked spindles from four rats). (e) Probability distribution of frequency for spindle type with changes for each rat (inset). Conventions and n are as in (d); P = 0.04; S vs. E P = 0.04. (f) Scatterplot of significantly phase-locked putative mPFC single units to IED-evoked spindles (E) vs. spontaneous spindles (S; Spearman’s rho = 0.52; P (Fisher R to Z) = 3 × 10⁻⁶; n = 74 units from four rats).
Figure 4
Figure 4
Hippocampal IEDs trigger mPFC spindles in all behavioral states. (a) mPFC (red) and hippocampal (blue) LFP with accelerometer trace (black) demonstrating an IED-evoked spindle in each behavioral state (scale bar = 500 μV, 1 s; traces from two rats). (b) Average normalized spectrogram in mPFC following hippocampal IED. Averaged mPFC power spectrum before (blue) and after (green) IED (inset; mean ± s.e.m.). (c) Change in mPFC z-scored spindle power before vs. after hippocampal IED (dark colored bars; Kruskal-Wallis P = 7.2 × 10⁻⁷; NREM vs. REM P = 4.3 × 10⁻⁵; NREM vs. Wake P = 6.1 × 10⁻⁶; (Bonferroni correction); n = 17 NREM, 14 REM, and 14 Wake sessions from four rats). Probability of mPFC spindle following hippocampal IED across states (light colored bars; Kruskal-Wallis P = 0.04; NREM vs. REM P = 0.03; (Bonferroni correction); n = 67 NREM, 98 REM, and 53 Wake sessions from four rats; * = P < 0.05). (d) Probability distribution of IED-evoked spindle duration in NREM (blue), REM (green), Wake (magenta). Changes in mean (open circle) and median (open square) spindle duration in each rat (inset; separate colors) across states (box plot tails = 25th and 75th percentiles; Kruskal-Wallis P = 2.0 × 10⁻⁴; NREM vs. REM P = 1.1 × 10⁻⁴; (Bonferroni correction); n = 220 NREM spindles, 193 REM spindles, 207 Wake spindles from four rats). (e) Probability distribution of IED-evoked spindle frequency in each behavioral state (Conventions and n are as in (d); P = 0.01; REM vs. Wake P = 0.01).
Figure 5
Figure 5
Hippocampal IEDs trigger cortical ‘DOWN’ states in the mPFC. (a) Averaged raw mPFC LFP in time window bordering hippocampal IED (dashed line) in each behavioral state (blue = NREM, green = REM, magenta = Wake; scale bar = 400 μV, 1 s; n = 40 traces from each state in one rat; similar findings in all other rats). (b) Average mPFC delta power (mean ± s.e.m.) in each behavioral state (time window, colors, n as in (a)). Delta power in REM prior to IED was used as adjusted baseline. (c) Stacked mPFC delta phases (2–5 Hz) in time window bordering individual hippocampal IEDs (rows) across states (blue = –pi, red = pi; scale bar = 50 trials, 500 ms; n = 259 NREM, 268 REM, 236 Wake IED trials from one rat; similar findings in all other rats). (d) Average peri-event firing rate histograms of representative putative mPFC pyramidal cells (left) and interneurons (right) in the time window bordering hippocampal IED (time zero; colors as in (a); n = 405 pyramidal cells and 22 interneurons from sample rat).
Figure 6
Figure 6
IEDs in subjects with epilepsy trigger cortical spindles. (a) LFP from IED electrode (upper; depth electrode in parahippocampal gyrus) demonstrating typical IED and subdural cortical electrode (lower; grid electrode in frontal cortex) demonstrating time-locked spindle. Grid shows z-scored spindle band power across cortical ECoG array triggered on above IED (occurrence time indicated by dashed line). White channels are nonfunctional (scale bar = 100 μV, 200 ms; duration of each grid LFP trace = 1.6 s). (b) Average spectrograms triggered on IED occurrence (orange box) for IED electrode (upper panel; sample IED LFP in orange), and a representative cortical grid electrode (lower panel; red box = time of spindle; scale bar = 1 s; n = 798 IED trials from one subject; similar results for all other subjects). (c) Schematic of ECoG grid and strip placement (each square = one recording electrode) on the projected pial surface of four subjects with epilepsy (high IED-spindle correlation = warm colors; low correlation = cool colors; Corr = normalized correlation). Cross-correlograms for high, intermediate, and low correlation electrodes from a sample subject on the right (three sessions for each of four subjects; total of 3,969, 2,077, 1,035, and 1,240 IEDs). Red ‘*’ shows location of IED electrode. (d) Stacked trials of delta power (left) and delta phase (right) in a cortical electrode centered on IED occurrence (blue = –pi, red = pi; scale bar = 25 trials, 500 ms; arrowhead = time of IED; n = 477 IED trials from one subject; similar results for all other subjects).

References

    1. Hermann BP, Seidenberg M, Dow C, et al. Cognitive prognosis in chronic temporal lobe epilepsy. Ann Neurol. 2006;60(1):80–87. - PubMed
    1. Ebus S, Arends J, Hendriksen J, et al. Cognitive effects of interictal epileptiform discharges in children. European journal of paediatric neurology : EJPN : official journal of the European Paediatric Neurology Society. 2012;16(6):697–706. - PubMed
    1. Lv Y, Wang Z, Cui L, Ma D, Meng H. Cognitive correlates of interictal epileptiform discharges in adult patients with epilepsy in China. Epilepsy Behav. 2013;29(1):205–210. - PubMed
    1. Binnie CD. Cognitive impairment during epileptiform discharges: is it ever justifiable to treat the EEG? The Lancet. Neurology. 2003;2(12):725–730. - PubMed
    1. Brinciotti M, Matricardi M, Paolella A, Porro G, Benedetti P. Neuropsychological correlates of subclinical paroxysmal EEG activity in children with epilepsy. 1: Qualitative features (generalized and focal abnormalities) Functional neurology. 1989;4(3):235–239. - PubMed

Publication types

MeSH terms