. 2016 Apr 25;11(4):e0153154.
doi: 10.1371/journal.pone.0153154. eCollection 2016.

The Limited Utility of Multiunit Data in Differentiating Neuronal Population Activity

Affiliations

The Limited Utility of Multiunit Data in Differentiating Neuronal Population Activity

Corey J Keller et al. PLoS One. .

Abstract

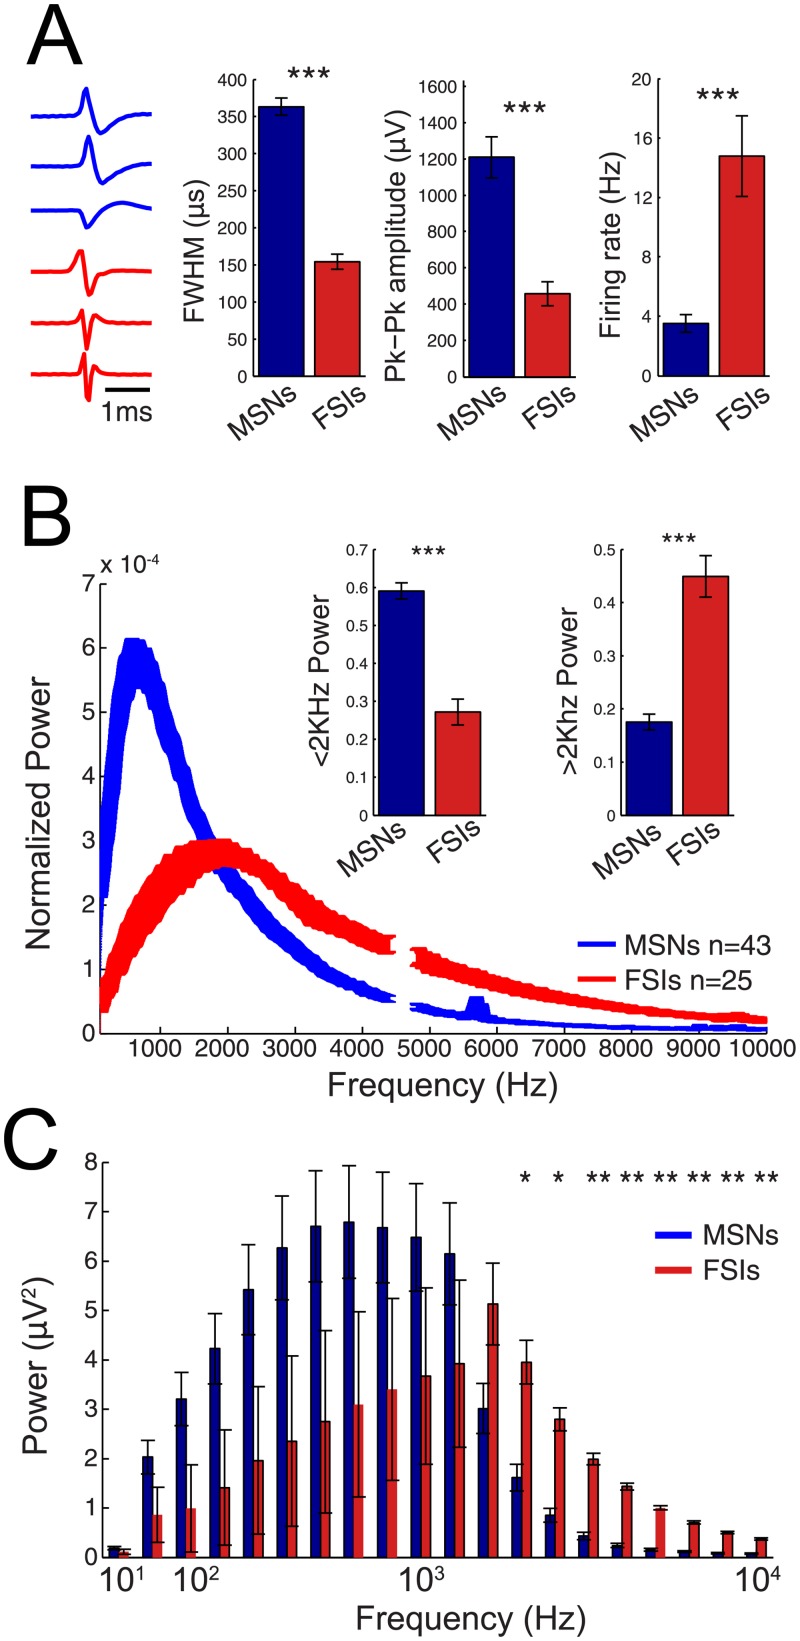
To date, single neuron recordings remain the gold standard for monitoring the activity of neuronal populations. Since obtaining single neuron recordings is not always possible, high frequency or 'multiunit activity' (MUA) is often used as a surrogate. Although MUA recordings allow one to monitor the activity of a large number of neurons, they do not allow identification of specific neuronal subtypes, the knowledge of which is often critical for understanding electrophysiological processes. Here, we explored whether prior knowledge of the single unit waveform of specific neuron types is sufficient to permit the use of MUA to monitor and distinguish differential activity of individual neuron types. We used an experimental and modeling approach to determine if components of the MUA can monitor medium spiny neurons (MSNs) and fast-spiking interneurons (FSIs) in the mouse dorsal striatum. We demonstrate that when well-isolated spikes are recorded, the MUA at frequencies greater than 100Hz is correlated with single unit spiking, highly dependent on the waveform of each neuron type, and accurately reflects the timing and spectral signature of each neuron. However, in the absence of well-isolated spikes (the norm in most MUA recordings), the MUA did not typically contain sufficient information to permit accurate prediction of the respective population activity of MSNs and FSIs. Thus, even under ideal conditions for the MUA to reliably predict the moment-to-moment activity of specific local neuronal ensembles, knowledge of the spike waveform of the underlying neuronal populations is necessary, but not sufficient.


Conflict of interest statement

Competing Interests: The authors have declared that no competing interests exist.

Figures

Fig 1
Fig 1. High frequency activity contains power from spikes above 100Hz.
A) Frequency representation of data containing spikes and not containing spikes. The spike used to calculate the frequency decomposition is shown on the left. Power due to noise in the recording at 5KHz was removed from the analysis. B-C) Relationship of B) width and C) peak-peak amplitude of spikes (n = 70) to power in the 300-400Hz band. D-E) Comparison of spiking characteristics to power across frequency bands. The correlation value from B and C is calculated for each band and plotted in D and E, respectively. Time scale = 1ms. FWHM = full width at half maximum.
Fig 2
Fig 2. High frequency power can reliably detect spikes.
A) 5s trace of power in 300-400Hz. Raster plots represent spikes whose color matches the waveform on left. Using a detection threshold (z > 2, dotted line), the sensitivity for three spikes on left was calculated. These percentages are shown next to their spike waveform. B) Sensitivity and specificity as a function of frequency for all cells, MSNs, and FSIs. Error bars denote SE. Time scale = 1 ms.
Fig 3
Fig 3. Neuronal cell types have specific high frequency signatures.
A) Left: Example spike waveforms of MSNs and FSIs. Right: MSNs exhibit wider width, higher amplitude, and lower firing rates. B) Mean power spectrum of MSN and FSIs. Mesh represents standard error. Each spike is normalized by the area under the curve prior to averaging. Insert: Comparison of power above and below 2KHz. C) Total power contribution from well-isolated spikes in a given frequency band. Analysis takes into consideration power in each frequency band due to a single spike as well as the firing rate of that cell. Error bars denote SE. Time scale = 1ms. ***p < .001, **p < .01, *p < .05.
Fig 4
Fig 4. High frequency power can predict neuronal cell type from single spikes.
A) BLP trace of recording. Raster plot represents times of increased activity above threshold (dotted line). B) Single trial power spectrum from time periods exhibiting high BLP. Features used for the binary classifier were extracted from the power spectrum as high and low power in frequencies. C) Support vector machine training set. Two channels were used for the training set. D) Top panel: Mean waveform traces extracted from time periods where the ratio of power in the high (3000-3500Hz) to low (500-600Hz) frequency bands were increased (red trace) and decreased (blue trace) as classified by the method illustrated in (C). Bottom panel: Group accuracy of classifying neuronal cell types based on spectral signature on a single trial basis. Power in low and high frequency bands were used as features in the binary classifier.
Fig 5
Fig 5. Modeling the spiking contribution to high frequency activity.
A) Experimental design. Blue and red traces represent the times at which the firing rate of MSNs and FSIs were modulated, respectively. B) Raster plots of a subset of MSNs (blue) and FSIs (red) used in the simulation. In this example, 20% of neurons were modulated. C) Instantaneous population firing rates for MSNs and FSIs when different proportions of neurons were modulated. The left shows population firing rates as a function of the proportion of neurons modulated when the sinusoidal input is positive (so that the input increases firing rates). The right panel shows population firing rates when the input is negative (so that the input decreases firing rates). Traces are color-coded based on the proportion of neurons that were driven by the input. D) Aggregate high frequency activity derived from the total spiking of all neurons used in the model. FSI and MSN contributions as well as the total activity for the duration (left) and a subset (right) of the recording.
Fig 6
Fig 6. Low MUA tracks MSN spiking while high MUA tracks MSN and FSI spiking.
A) Top: Traces of the firing rates (FR) of MSNs and FSIs. Bottom: power changes in low (0.3-2KHz) and high (8-10KHz) frequencies within the MUA range. B) Correlation between low MUA power and MSN firing rates for all firing rates in one cycle of modulation (gray dotted bars in A). Correlation for low MSN firing rates are expanded in the right panel. Correlation value from one cycle is denoted by the black arrow pointing to the blue circle in C. C) Correlation between power in different frequency bands and population MSN and FSI firing rates during spiking with no modulation, modulation of MSNs, FSIs, or both MSNs and FSIs as illustrated in A. Gray bars denote frequency bands used in the classifier in Fig 7.
Fig 7
Fig 7. In the absence of well-isolated spikes, the spectral signature of MUA is a poor predictor of evoked neuronal ensemble dynamics.
A) Representative MSN (blue) and FSI (red) spike waveforms used in simulation. Time scale = 1ms. B) Results of simulations of high frequency activity derived from spiking. Data is from simulation where 60% of neurons were modulated. Each data point represents the low and high frequency power during 10ms time windows in the simulation. Colored data points represent time bins where the instantaneous firing rate of certain populations deviated from baseline. For each color, the direction of simulated spiking activity for MSNs and FSIs is shown in the legend on the right panel. For example, green dots represent 10ms time bins where both MSNs and FSIs increased in spiking activity. Black dotted lines represent the significance threshold for determining if low or high MUA reached significance (>2SD) during a time window. The gray dotted insert shows a detailed version of data on the left of the figure. C-E) Classifier results. C) Overall accuracy for correctly predicting population activity as a function of the proportion of neurons whose activity was modulated during the simulation. Dotted line denotes chance level (8-way classifier). D) Relationship of the accuracy of detecting each type of firing rate deviation on the overall accuracy of technique. Data is shown for simulation where the input drives 60% of neurons. E) Accuracy of predicting MSN dynamics with low MUA and the accuracy of predicting FSI dynamics with high MUA. Data shown as a function of the proportion of neurons modulated during simulation.
Fig 8
Fig 8. Accuracy of MUA predicting evoked population dynamics depends on population parameters.
A-B) Comparison of actual and predicted population firing rate for A) MSNs from low MUA (0.3–2 KHz) and B) FSIs from high MUA (8–10 KHz). Data is from simulation where 60% of neurons were modulated. Dotted vertical line denotes mean population firing rate. Dotted diagonal line represents unity line. Error bars denote S.D. Correlation value is from linear best-fit line. Note that at high population firing rates MSNs are not predicted well from low MUA, and at low population firing rates FSIs are not predicted well from high MUA. C-D) Surface plots of prediction error for C) MSNs and D) FSIs as a function of actual population firing rate and the percent of population responsive to input. Transparent planes represent mean firing rate of population (vertical plane) and 0% prediction error (horizontal plane).

Similar articles

Cited by

References

    1. Hatsopoulos NG, Ojakangas CL, Paninski L, Donoghue JP. Information about movement direction obtained from synchronous activity of motor cortical neurons. Proc Natl Acad Sci U S A. 1998;95(26):15706–11. Epub 1998/12/23. - PMC - PubMed
    1. Maynard EM, Hatsopoulos NG, Ojakangas CL, Acuna BD, Sanes JN, Normann RA, et al. Neuronal interactions improve cortical population coding of movement direction. J Neurosci. 1999;19(18):8083–93. Epub 1999/09/10. . - PMC - PubMed
    1. Taylor DM, Tillery SI, Schwartz AB. Direct cortical control of 3D neuroprosthetic devices. Science. 2002;296(5574):1829–32. Epub 2002/06/08. 10.1126/science.1070291 . - DOI - PubMed
    1. Hoffman KL, McNaughton BL. Coordinated reactivation of distributed memory traces in primate neocortex. Science. 2002;297(5589):2070–3. Epub 2002/09/21. 10.1126/science.1073538 . - DOI - PubMed
    1. Jia X, Tanabe S, Kohn A. gamma and the coordination of spiking activity in early visual cortex. Neuron. 2013;77(4):762–74. Epub 2013/02/27. 10.1016/j.neuron.2012.12.036 - DOI - PMC - PubMed

Publication types

LinkOut - more resources