

Skeletal Muscle Insulin Resistance and Absence of Inflammation Characterize Insulin-Resistant Grade I Obese Women
- PMID: 27111539
- PMCID: PMC4844150
- DOI: 10.1371/journal.pone.0154119
Skeletal Muscle Insulin Resistance and Absence of Inflammation Characterize Insulin-Resistant Grade I Obese Women
Abstract
Context: Obesity is associated with insulin-resistance (IR), the key feature of type 2 diabetes. Although chronic low-grade inflammation has been identified as a central effector of IR development, it has never been investigated simultaneously at systemic level and locally in skeletal muscle and adipose tissue in obese humans characterized for their insulin sensitivity.
Objectives: We compared metabolic parameters and inflammation at systemic and tissue levels in normal-weight and obese subjects with different insulin sensitivity to better understand the mechanisms involved in IR development.
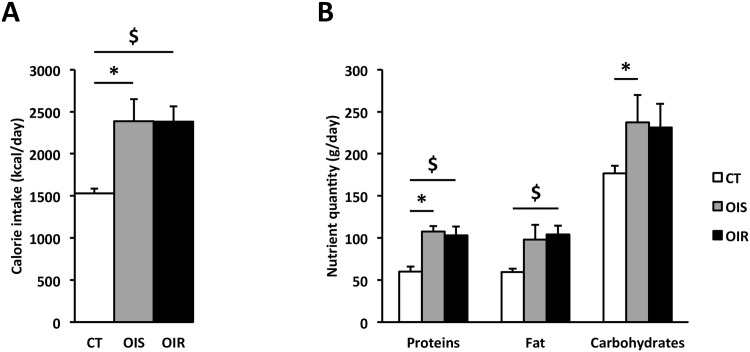
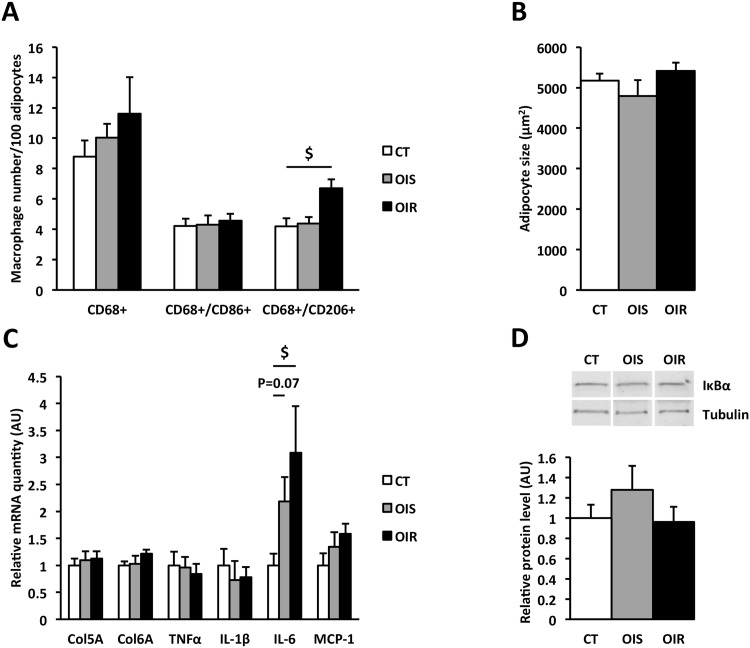
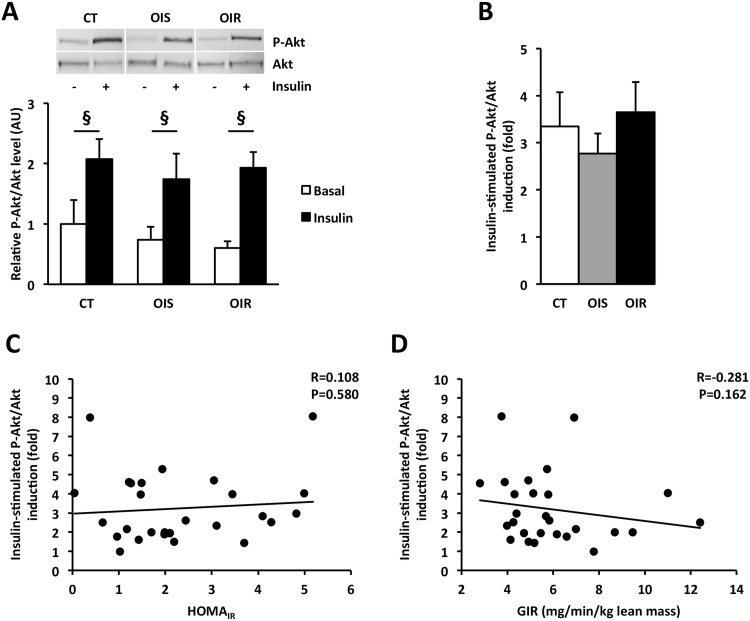
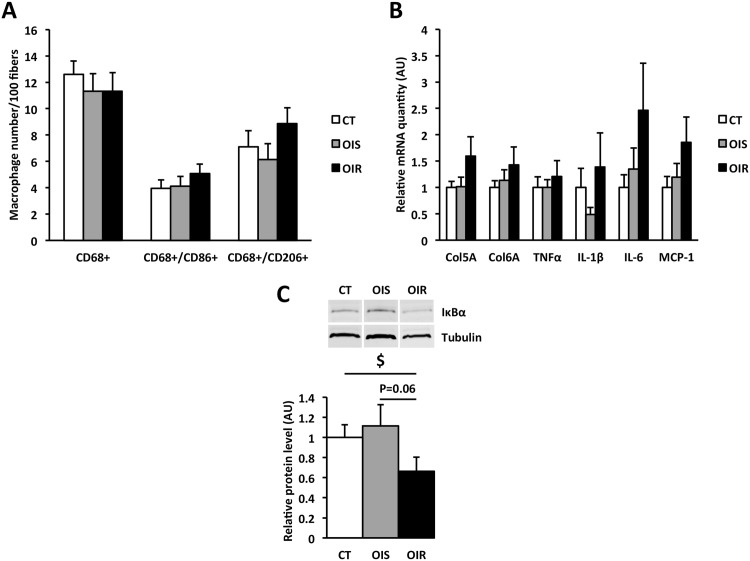
Methods: 30 post-menopausal women were classified as normal-weight insulin-sensitive (controls, CT) and obese (grade I) insulin-sensitive (OIS) or insulin-resistant (OIR) according to their body mass index and homeostasis model assessment of IR index. They underwent a hyperinsulinemic-euglycemic clamp, blood sampling, skeletal muscle and subcutaneous adipose tissue biopsies, an activity questionnaire and a self-administrated dietary recall. We analyzed insulin sensitivity, inflammation and IR-related parameters at the systemic level. In tissues, insulin response was assessed by P-Akt/Akt expression and inflammation by macrophage infiltration as well as cytokines and IκBα expression.
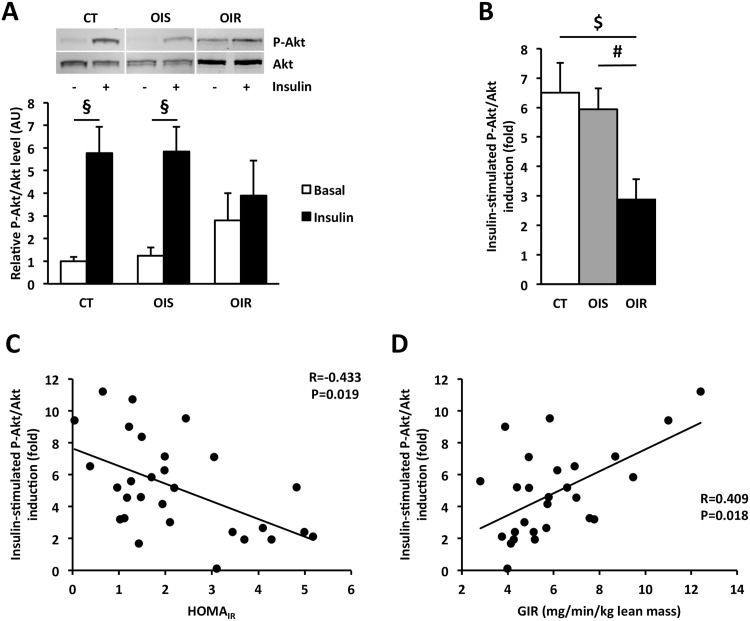
Results: Systemic levels of lipids, adipokines, inflammatory cytokines, and lipopolysaccharides were equivalent between OIS and OIR subjects. In subcutaneous adipose tissue, the number of anti-inflammatory macrophages was higher in OIR than in CT and OIS and was associated with higher IL-6 level. Insulin induced Akt phosphorylation to the same extent in CT, OIS and OIR. In skeletal muscle, we could not detect any inflammation even though IκBα expression was lower in OIR compared to CT. However, while P-Akt/Akt level increased following insulin stimulation in CT and OIS, it remained unchanged in OIR.
Conclusion: Our results show that systemic IR occurs without any change in systemic and tissues inflammation. We identified a muscle defect in insulin response as an early mechanism of IR development in grade I obese post-menopausal women.
Conflict of interest statement
Figures
Similar articles
-
Decreased RNF41 expression leads to insulin resistance in skeletal muscle of obese women.Metabolism. 2018 Jun;83:81-91. doi: 10.1016/j.metabol.2018.01.014. Epub 2018 Feb 2. Metabolism. 2018. PMID: 29410345
-
Chronic ethanol-induced insulin resistance is associated with macrophage infiltration into adipose tissue and altered expression of adipocytokines.Alcohol Clin Exp Res. 2007 Sep;31(9):1581-8. doi: 10.1111/j.1530-0277.2007.00452.x. Epub 2007 Jul 11. Alcohol Clin Exp Res. 2007. PMID: 17624994
-
Pancreastatin inhibitor PSTi8 protects the obesity associated skeletal muscle insulin resistance in diet induced streptozotocin-treated diabetic mice.Eur J Pharmacol. 2020 Aug 15;881:173204. doi: 10.1016/j.ejphar.2020.173204. Epub 2020 May 19. Eur J Pharmacol. 2020. PMID: 32439261
-
Recent advances in the relationship between obesity, inflammation, and insulin resistance.Eur Cytokine Netw. 2006 Mar;17(1):4-12. Eur Cytokine Netw. 2006. PMID: 16613757 Review.
-
The Change of Skeletal Muscle Caused by Inflammation in Obesity as the Key Path to Fibrosis: Thoughts on Mechanisms and Intervention Strategies.Biomolecules. 2024 Dec 27;15(1):20. doi: 10.3390/biom15010020. Biomolecules. 2024. PMID: 39858415 Free PMC article. Review.
Cited by
-
A Single Bout of Electroacupuncture Remodels Epigenetic and Transcriptional Changes in Adipose Tissue in Polycystic Ovary Syndrome.Sci Rep. 2018 Jan 30;8(1):1878. doi: 10.1038/s41598-017-17919-5. Sci Rep. 2018. PMID: 29382850 Free PMC article.
-
Muscle Oxidative Stress Plays a Role in Hyperthyroidism-Linked Insulin Resistance.Antioxidants (Basel). 2023 Feb 27;12(3):592. doi: 10.3390/antiox12030592. Antioxidants (Basel). 2023. PMID: 36978840 Free PMC article.
-
Analysis of intra and extramyocellular lipids in the multifidus muscle in patients with chronic low back pain using MR spectroscopy.Br J Radiol. 2018 Feb;91(1083):20170536. doi: 10.1259/bjr.20170536. Epub 2018 Jan 2. Br J Radiol. 2018. PMID: 29227152 Free PMC article.
-
Grape Polyphenols in the Treatment of Human Skeletal Muscle Damage Due to Inflammation and Oxidative Stress during Obesity and Aging: Early Outcomes and Promises.Molecules. 2022 Oct 5;27(19):6594. doi: 10.3390/molecules27196594. Molecules. 2022. PMID: 36235130 Free PMC article. Review.
-
Ischemic Stroke in Women: Understanding Sex-Specific Risk Factors, Treatment Considerations, and Outcomes.J Cardiovasc Dev Dis. 2024 Nov 29;11(12):382. doi: 10.3390/jcdd11120382. J Cardiovasc Dev Dis. 2024. PMID: 39728272 Free PMC article. Review.
References
-
- Defronzo RA, Simonson D, Ferrannini E, Barrett E. Insulin resistance: a universal finding in diabetic states. Bull Schweiz Akad Med Wiss 1981; 223–238. - PubMed
-
- Hotamisligil GS. Inflammation and metabolic disorders. Nature 2006; 444: 860–867. - PubMed
-
- Steinberg GR. Inflammation in obesity is the common link between defects in fatty acid metabolism and insulin resistance. Cell Cycle 2007; 6: 888–894. - PubMed
-
- Varma V, Yao-Borengasser A, Rasouli N, Nolen GT, Phanavanh B, Starks T, et al. Muscle inflammatory response and insulin resistance: synergistic interaction between macrophages and fatty acids leads to impaired insulin action. Am J Physiol Endocrinol Metab 2009; 296: E1300–1310. 10.1152/ajpendo.90885.2008 - DOI - PMC - PubMed
Publication types
MeSH terms
Substances
LinkOut - more resources
Full Text Sources
Other Literature Sources
Medical
