. 2016 Jun;18(6):684-91.
doi: 10.1038/ncb3344. Epub 2016 Apr 25.

Centromeric DNA replication reconstitution reveals DNA loops and ATR checkpoint suppression

Affiliations

Centromeric DNA replication reconstitution reveals DNA loops and ATR checkpoint suppression

Antoine Aze et al. Nat Cell Biol. 2016 Jun.

Abstract

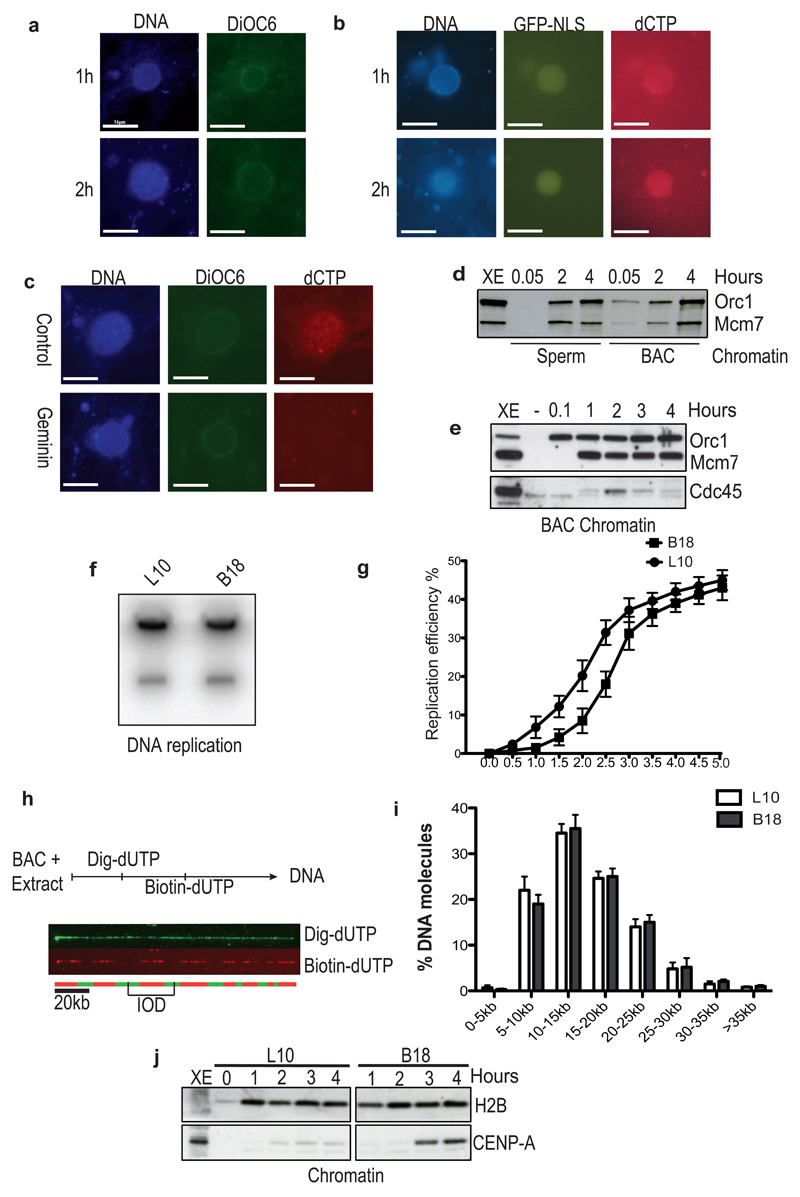
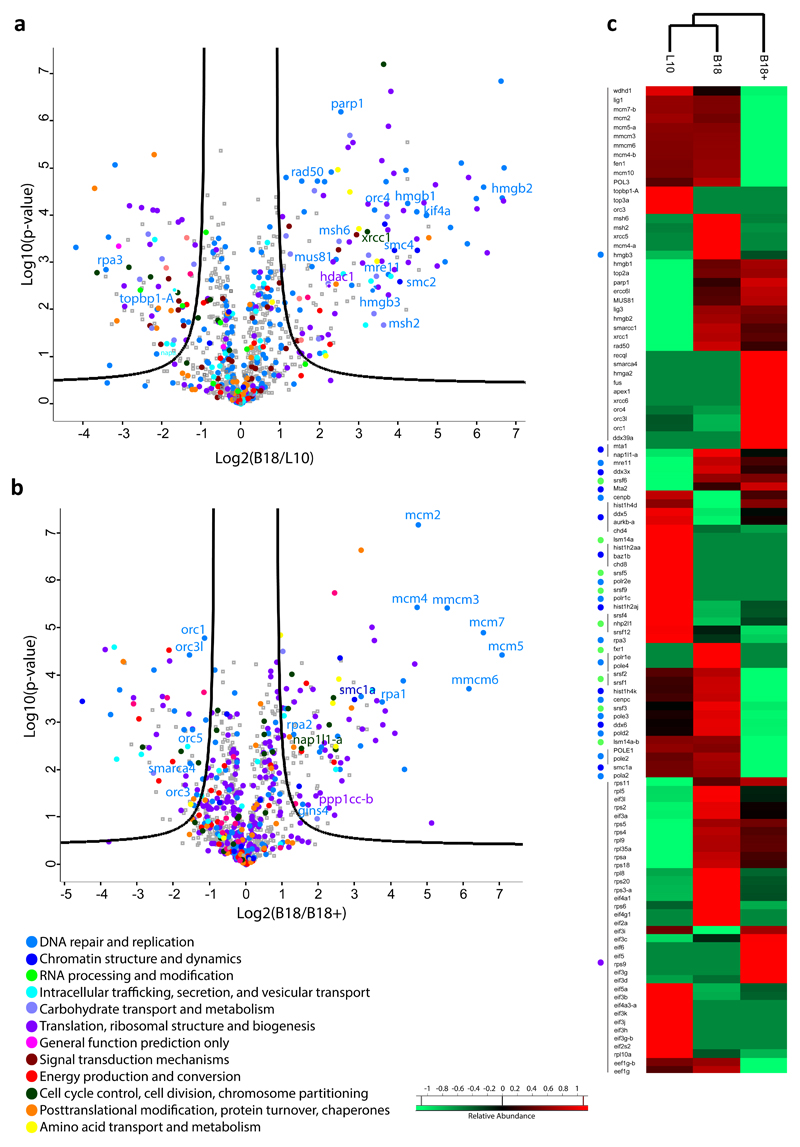
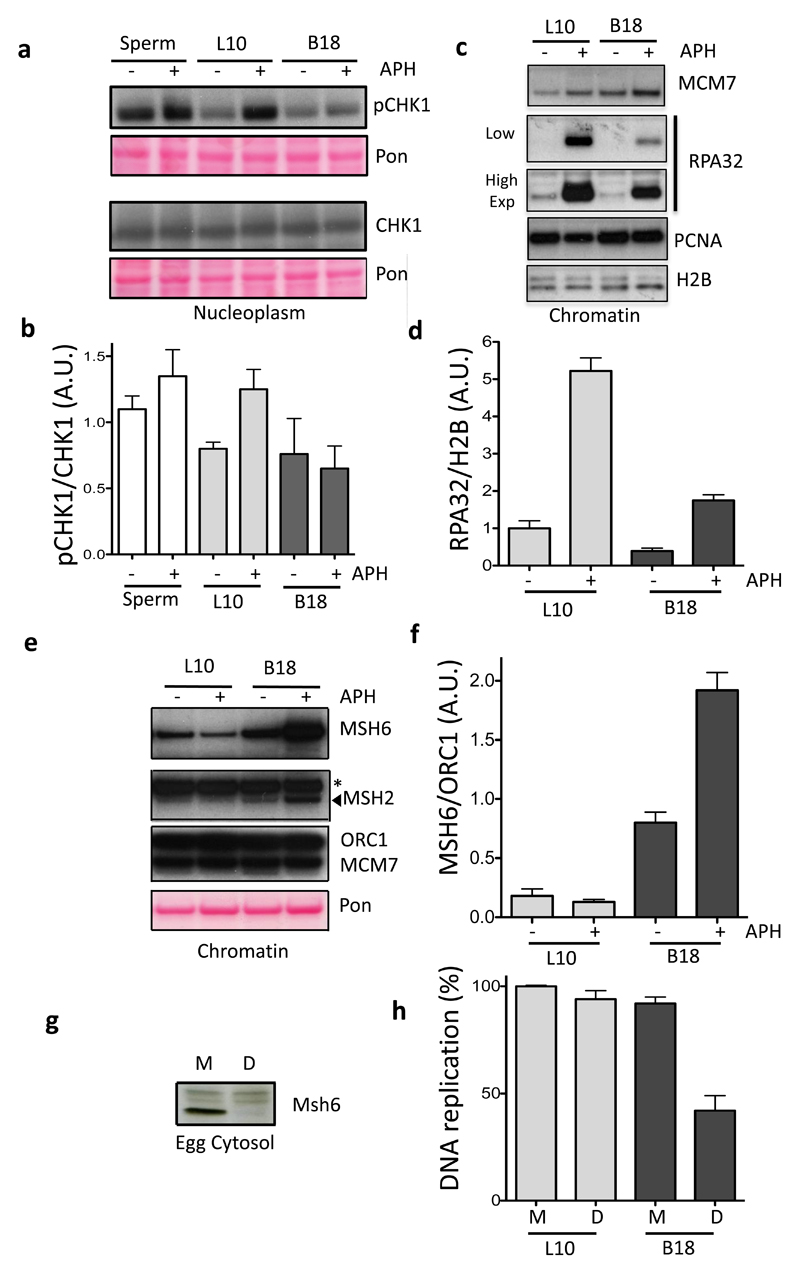
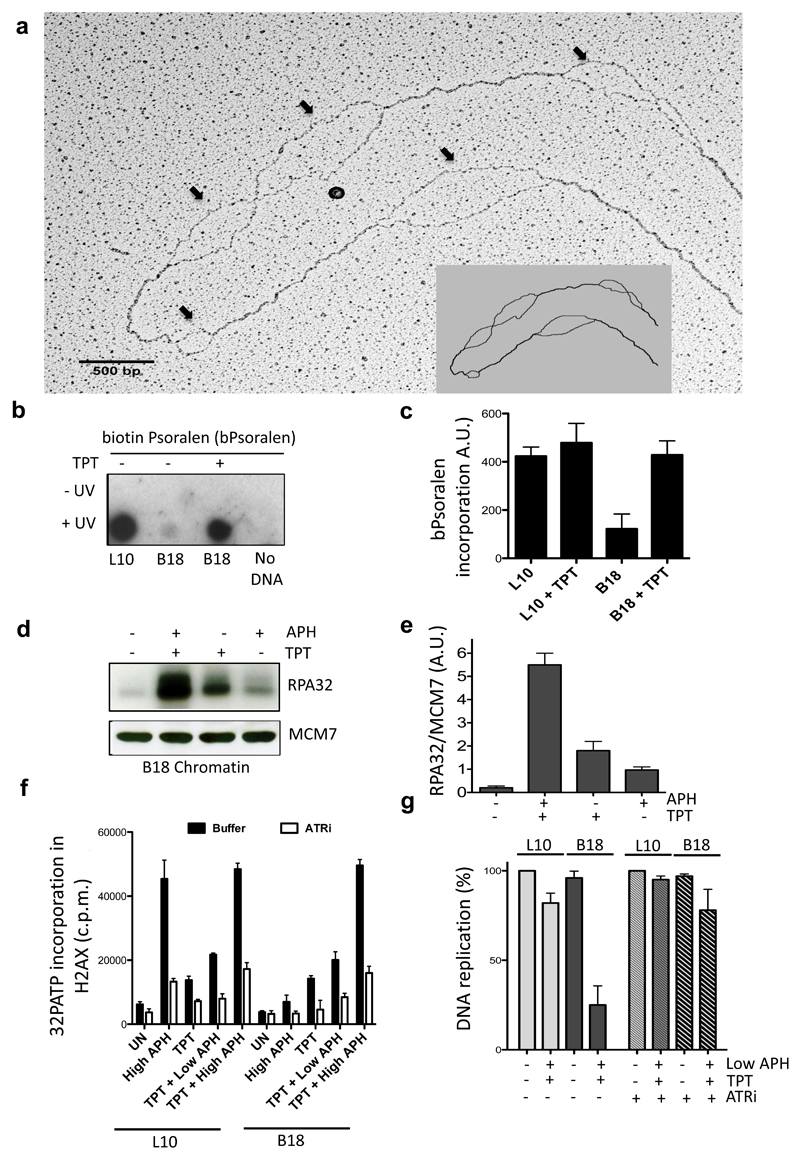
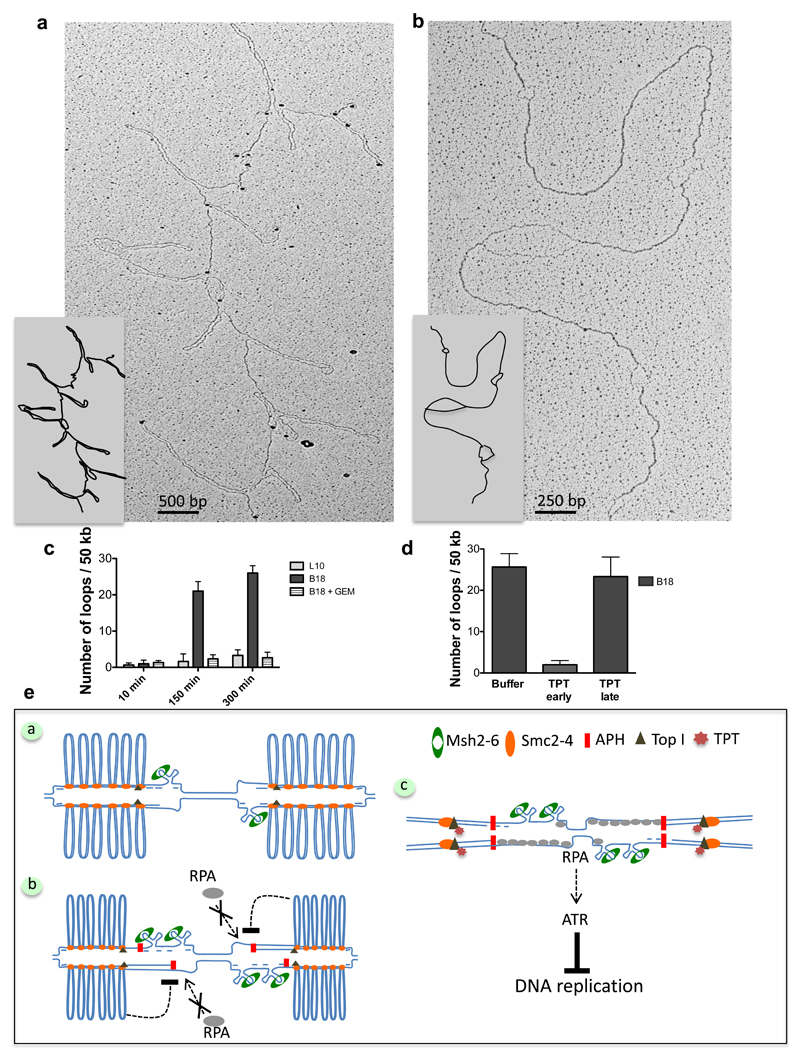
Half of the human genome is made up of repetitive DNA. However, mechanisms underlying replication of chromosome regions containing repetitive DNA are poorly understood. We reconstituted replication of defined human chromosome segments using bacterial artificial chromosomes in Xenopus laevis egg extract. Using this approach we characterized the chromatin assembly and replication dynamics of centromeric alpha-satellite DNA. Proteomic analysis of centromeric chromatin revealed replication-dependent enrichment of a network of DNA repair factors including the MSH2-6 complex, which was required for efficient centromeric DNA replication. However, contrary to expectations, the ATR-dependent checkpoint monitoring DNA replication fork arrest could not be activated on highly repetitive DNA due to the inability of the single-stranded DNA binding protein RPA to accumulate on chromatin. Electron microscopy of centromeric DNA and supercoil mapping revealed the presence of topoisomerase I-dependent DNA loops embedded in a protein matrix enriched for SMC2-4 proteins. This arrangement suppressed ATR signalling by preventing RPA hyper-loading, facilitating replication of centromeric DNA. These findings have important implications for our understanding of repetitive DNA metabolism and centromere organization under normal and stressful conditions.


Figures

Figure 1
Figure 1. BAC DNA induced nuclei formation and DNA synthesis in interphase Xenopus egg extract.
(a) BACs were incubated in interphase extract for the indicated time. Samples were fixed and stained with DAPI for DNA (DNA) and DiOC6 for membranes (DiOC6). (b) Nuclei assembled in interphase extract supplemented with GFP-NLS and Cy3-dCTP (dCTP). (c) BACs replicated for 4 hours in egg extract supplemented with buffer (Control) or recombinant geminin (Geminin). (d) and (e) Chromatin isolated from sperm and BACs nuclei at different times and analysed by WB with the indicated antibodies. Representative images of experiments performed at least three times are shown. (f) Autoradiography of non-centromeric (L10) and centromeric (B18) BACs replicated in the presence of 32PdCTP. A representative image is shown. (g) Replication kinetics of non-centromeric L10 and centromeric B18 DNA. Error bars represent ± sd of the mean. n=3 experiments; p<0.001 when comparing L10 and B18 mean values for all the indicated times; unpaired two-tailed t-test. (h) Scheme of DNA combing experiment and example of DNA fiber visualization by immunofluorescence. BACs were incubated in egg extract, supplemented with Dig-dUTP (Green) and, at later time points, with Biotin-dUTP (Red). DNA was isolated at 3.5 hours from addition to egg extract for combing. Typical combing of L10 BAC is shown. Midpoints of green tracts (Dig-dUTP) represent origins of DNA replication (replication eye in the red track). Distance between midpoints of two adjacent replication eyes represents inter-origins distance (IOD) (i) Graph showing distribution percentage of IODs measured for control L10 (black) and B18 DNA (grey). At least hundred fibres were scored for each sample. Error bars represent ± sd of the mean. n=3 experiments; p<0.001 when comparing L10 and B18 mean values for all IODs; One-way Anova. (j) Chromatin was isolated at the indicated times of the replication reactions with L10 and B18 DNA and then analyzed by WB using the indicated antibodies. A representative of 3 experiments is shown. Uncropped gel images for all experiments are shown in Supplementary Figure 6.
Figure 2
Figure 2. Proteomic analysis of replicating centromeric and non-cetromeric chromatin using label free quantitative MS.
(a) Centromeric B18 and non-centromeric L10 chromatin was isolated after 150 minutes incubation of BAC DNA in egg extract and analysed by high resolution MS-MS. Volcano plots show the mean log2 protein B18/L10 ratio plotted against the p-values of biological replicates. Proteins differentially represented on centromeric and non-centromeric chromatin are shown. Black lines indicate the significance cut off. (b) Proteins differentially represented on centromeric chromatin in the absence (B18) or in the presence (B18+) of geminin analysed as in (a) are shown. Experiments shown in (a) and (b) were repeated with three different extracts (see Methods and Table S2 for statistical significance). (c) Heat map for some non-centromeric (L10) and centromeric (B18) or geminin sensitive (B18+) proteins. Chromatin enriched proteins are in red, depleted proteins in green.
Figure 3
Figure 3. Centromeric DNA Replication is associated with checkpoint suppression and MMR proteins accumulation
(a) Sperm nuclei, L10 or B18 BACs were incubated in egg extract treated with 25 μg ml-1 aphidicolin (APH) (+) or buffer (-). Cytoplasmic CHK1 and its phosphorylated form (pCHK1) were detected using specific antibodies as indicated. Total transferred proteins were stained with Ponceau (Pon). (b) The average ratio of pCHK1 signal over the total level of CHK1 was quantified and plotted in the graph. Error bars represent ± sd of the mean. n=5 independent experiments; p<0.05 when comparing Sperm, L10 and B18 mean values for APH (+) or buffer (-) treated conditions; One-way Anova. (c) Chromatin from L10 and B18 BACs was isolated after 150 minutes of incubation in extracts supplemented with APH (+) or buffer (-). Samples were analysed by WB using antibodies against the indicated proteins. (d) Average ratio of RPA32 over Histone H2B (H2B) signal was quantified and shown in the graph. Error bars represent ± sd of the mean. n=7 independent experiments; p<0.01 when comparing L10 and B18 mean values for APH (+) or buffer (-) treated conditions; One-way Anova. (e) Chromatin from L10 and B18 BACs treated as in (c) was analysed by WB with the indicated antibodies. Total transferred proteins were stained with Ponceau (Pon). Asterisk indicates non-specific band. (f) Average ratio of MSH6 over ORC1 bound to chromatin was quantified and shown in the graph. Error bars represent ± sd of the mean. n=3 independent experiments; p<0.05 when comparing L10 and B18 mean values for APH (+) or buffer (-) treated conditions; One-way Anova. (g) WB of egg cytosol that was mock (M) or MSH6 depleted (D) using anti Xenopus MSH6 antibodies. A typical result is shown. (h) L10 and B18 DNA replication in mock (M) and MSH6 depleted (D) extracts. Relative average percentage of 32PdCTP incorporation is shown. L10 values in mock-depleted extracts were considered 100%. Error bars represent ± sd of the mean. n=3 experiments; p<0.05 when comparing L10 and B18 mean values for Mock (M) and MSH6 depleted extracts (D); One-way Anova.
Figure 4
Figure 4. Overwound centromeric DNA suppresses RPA accumulation and ATR activation.
(a) EM of B18 DNA isolated after 150 minutes incubation in interphase extract. Arrows indicate ssDNA bubbles. Scheme is included. Data represent 1 out of 3 experiments. (b) Streptavidin-HRP stained dot blot of L10 ad B18 DNA isolated from BAC nuclei replicated with 40 μM topotecan (TPT) or left untreated and treated with biotin-psoralen (bPsoralen) in the presence (+) or absence (-) of UV. Data represent 1 out of 3 experiments (c) Total incorporated bPsoralen was measured using a fluorescence based biotin quantification assay. Values represent fluorescence intensity expressed in arbitrary units. Error bars represent ± sd of the mean. n=3 experiments; p<0.05 when comparing L10 and B18 mean values for all treatments; One-way Anova. (d) WB of RPA32 and MCM7 bound to B18 chromatin isolated from nuclei replicated in the presence of 40 μM topotecan (TPT) and 25 μg ml-1 APH as indicated. (e) RPA32/MCM7 ratio. Error bars represent ± sd of the mean. n=3 experiments; p<0.01 when comparing B18 mean values for all treatments; One-way Anova. (f) Average incorporation of P in histone H2AX C-terminal peptide in the presence of nucleoplasm derived from L10 and B18 nuclei replicated in extracts that were untreated (UN), treated with 25 μg ml-1 APH (High APH), 40 μM TPT, TPT and 1 μg ml-1 APH (TPT + Low APH) or TPT and 25 μg ml-1 APH (TPT + High APH). Reactions were performed in the absence (black bars) or in the presence (white bars) of 10 μM VE-821 (ATRi). Error bars represent ± sd of the mean. n=3 experiments; p<0.001 when comparing B18 and L10 mean values for all treatments; One-way Anova. (g) L10 and B18 DNA replication in extracts treated with 40 μM TPT and 1 μg ml-1 APH (Low APH) in the presence or absence of ATRi as indicated. Relative average percentage of 32PdCTP incorporation is shown. L10 values in untreated extracts were considered 100%. Error bars represent ± sd of the mean. n=3 experiments; p<0.001 when comparing B18 and L10 mean values for all treatments; One-way Anova.
Figure 5
Figure 5. Centromeric BACs generate stable double stranded DNA loops during DNA replication.
(a) EM of centromeric B18 chromatin isolated after partial proteinase K digestion (See Methods). (b) EM analysis of samples isolated as in (a) and subjected to complete protein digestion. (c) Graph showing the frequency of DNA loops in L10 or B18 DNA incubated in extracts that were untreated or treated with geminin (Gem) for the indicated times. Experiments were repeated three times scoring the equivalent of about one mega base of DNA in total. Error bars represent ± sd of the mean. n=3 experiments; p<0.001 when comparing L10, B18 and B18 + Gem mean values for the indicated times; One-way Anova. (d) Frequency of loops on B18 DNA incubated in extracts supplemented with buffer or treated with TPT at the start of reaction (TPT early) or after its completion at 300 minutes (TPT late) and collected one hour later. Experiments were repeated three times scoring the equivalent of about one mega base of total DNA. Error bars represent ± sd of the mean. n=3 experiments; p<0.001 when comparing B18 mean values for all treatments; One-way Anova. (e) Model illustrating arrangement and response to replication stress of centromeric chromatin, which is organized in loops of dsDNA formed in the presence of Condensins (SMC2-4) and active Topoisomerase I (Top I). Loops accumulate most likely behind replication forks. Individual centromeric repeats might form hairpins or other secondary structures on unwound ssDNA at replication forks, attracting MMR proteins, which might be required to resolve them (Panel a). This topological arrangement limits the formation of extensive ssDNA regions and RPA hyper-loading onto chromatin triggered by the uncoupling of helicase and polymerase induced by aphidicolin (APH) or other fork stalling events. Inhibition of RPA binding to chromatin prevents activation of ATR. ssDNA generated during fork uncoupling folds into several hairpins, leading to MMR proteins accumulation (Panel b). Interference with contromeric DNA topology by Toposimerase I inhibitor (TPT) restores RPA loading and ATR activity, which inhibits centromeric DNA replication (Panel c), suggesting that topology dependent suppression of ATR normally facilitates replication of hard-to-replicate repetitive DNA sequences present at the centromere.

Comment in

References

    1. Mirkin SM. Expandable DNA repeats and human disease. Nature. 2007;447:932–940. - PubMed
    1. Zhao J, Bacolla A, Wang G, Vasquez KM. Non-B DNA structure-induced genetic instability and evolution. Cellular and molecular life sciences : CMLS. 2010;67:43–62. - PMC - PubMed
    1. Zeman MK, Cimprich KA. Causes and consequences of replication stress. Nature cell biology. 2014;16:2–9. - PMC - PubMed
    1. Murphy TD, Karpen GH. Centromeres take flight: alpha satellite and the quest for the human centromere. Cell. 1998;93:317–320. - PubMed
    1. Rudd MK, Wray GA, Willard HF. The evolutionary dynamics of alpha-satellite. Genome research. 2006;16:88–96. - PMC - PubMed

Publication types