Detecting cell lysis using viscosity monitoring in E. coli fermentation to prevent product loss
- PMID: 27111912
- PMCID: PMC4999026
- DOI: 10.1002/btpr.2292
Detecting cell lysis using viscosity monitoring in E. coli fermentation to prevent product loss
Abstract
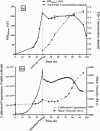
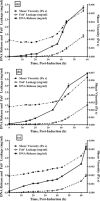
Monitoring the physical or chemical properties of cell broths to infer cell status is often challenging due to the complex nature of the broth. Key factors indicative of cell status include cell density, cell viability, product leakage, and DNA release to the fermentation broth. The rapid and accurate prediction of cell status for hosts with intracellular protein products can minimise product loss due to leakage at the onset of cell lysis in fermentation. This article reports the rheological examination of an industrially relevant E. coli fermentation producing antibody fragments (Fab'). Viscosity monitoring showed an increase in viscosity during the exponential phase in relation to the cell density increase, a relatively flat profile in the stationary phase, followed by a rapid increase which correlated well with product loss, DNA release and loss of cell viability. This phenomenon was observed over several fermentations that a 25% increase in broth viscosity (using induction-point viscosity as a reference) indicated 10% product loss. Our results suggest that viscosity can accurately detect cell lysis and product leakage in postinduction cell cultures, and can identify cell lysis earlier than several other common fermentation monitoring techniques. This work demonstrates the utility of rapidly monitoring the physical properties of fermentation broths, and that viscosity monitoring has the potential to be a tool for process development to determine the optimal harvest time and minimise product loss. © 2016 The Authors. Biotechnology Progress published by Wiley Periodicals, Inc. on behalf of American Institute of Chemical Engineers, 32:1069-1076, 2016.
Keywords: E. coli; cell lysis; fermentation process monitoring; product leakage; viscosity.
© 2016 The Authors. Biotechnology Progress published by Wiley Periodicals, Inc. on behalf of American Institute of Chemical Engineers.
Figures


Similar articles
-
Development of a high yielding E. coli periplasmic expression system for the production of humanized Fab' fragments.Biotechnol Prog. 2017 Jan;33(1):212-220. doi: 10.1002/btpr.2393. Epub 2016 Nov 17. Biotechnol Prog. 2017. PMID: 27790865
-
Comparison of techniques for monitoring antibody fragment production in E. coli fermentation cultures.Biotechnol Prog. 2002 Nov-Dec;18(6):1431-8. doi: 10.1021/bp0201152. Biotechnol Prog. 2002. PMID: 12467481
-
Evaluation of options for harvest of a recombinant E. Coli fermentation producing a domain antibody using ultra scale-down techniques and pilot-scale verification.Biotechnol Prog. 2016 Mar;32(2):382-92. doi: 10.1002/btpr.2220. Epub 2016 Jan 12. Biotechnol Prog. 2016. PMID: 26698375 Free PMC article.
-
Production of antibodies and antibody fragments in Escherichia coli and a comparison of their functions, uses and modification.Curr Opin Drug Discov Devel. 2003 Mar;6(2):188-96. Curr Opin Drug Discov Devel. 2003. PMID: 12669454 Review.
-
Minimizing acetate formation in E. coli fermentations.J Ind Microbiol Biotechnol. 2007 Nov;34(11):689-700. doi: 10.1007/s10295-007-0244-2. Epub 2007 Aug 1. J Ind Microbiol Biotechnol. 2007. PMID: 17668256 Review.
Cited by
-
Rheological Behavior of High Cell Density Pseudomonas putida LS46 Cultures during Production of Medium Chain Length Polyhydroxyalkanoate (PHA) Polymers.Bioengineering (Basel). 2019 Oct 9;6(4):93. doi: 10.3390/bioengineering6040093. Bioengineering (Basel). 2019. PMID: 31600906 Free PMC article.
-
Secretion of recombinant proteins from E. coli.Eng Life Sci. 2018 Apr 14;18(8):532-550. doi: 10.1002/elsc.201700200. eCollection 2018 Aug. Eng Life Sci. 2018. PMID: 32624934 Free PMC article. Review.
-
Recovery of bacterioruberin and proteins using aqueous solutions of surface-active compounds.RSC Adv. 2022 Oct 24;12(47):30278-30286. doi: 10.1039/d2ra02581g. eCollection 2022 Oct 24. RSC Adv. 2022. PMID: 36337967 Free PMC article.
-
Recombinant Peptide Production Softens Escherichia coli Cells and Increases Their Size during C-Limited Fed-Batch Cultivation.Int J Mol Sci. 2023 Jan 30;24(3):2641. doi: 10.3390/ijms24032641. Int J Mol Sci. 2023. PMID: 36768962 Free PMC article.
-
A production platform for disulfide-bonded peptides in the periplasm of Escherichia coli.Microb Cell Fact. 2024 Jun 5;23(1):166. doi: 10.1186/s12934-024-02446-6. Microb Cell Fact. 2024. PMID: 38840157 Free PMC article.
References
-
- Nelson AL, Reichert JM. Development trends for therapeutic antibody fragments. Nat Biotechnol. 2009;27:331–337. - PubMed
-
- Li Q, Mannall GJ, Ali S, Hoare M. An ultra scale‐down approach to study the interaction of fermentation, homogenization, and centrifugation for antibody fragment recovery from rec E. coli . Biotechnol Bioeng. 2013;110:2150–2160. - PubMed
-
- Shiloach J, Fass R. Growing E. coli to high cell density—a historical perspective on method development. Biotechnol Adv. 2005;23:345–357. - PubMed
-
- Riesenberg D, Guthke R. High‐cell‐density cultivation of microorganisms. Appl Microbiol Biotechnol. 1999;51:422–430. - PubMed
MeSH terms
Substances
LinkOut - more resources
Full Text Sources
Other Literature Sources
Molecular Biology Databases

