. 2016 Jul;5(7):925-37.
doi: 10.5966/sctm.2015-0247. Epub 2016 Apr 25.

Targeting the cAMP and Transforming Growth Factor-β Pathway Increases Proliferation to Promote Re-Epithelialization of Human Stem Cell-Derived Retinal Pigment Epithelium

Affiliations

Targeting the cAMP and Transforming Growth Factor-β Pathway Increases Proliferation to Promote Re-Epithelialization of Human Stem Cell-Derived Retinal Pigment Epithelium

Parul Choudhary et al. Stem Cells Transl Med. 2016 Jul.

Abstract

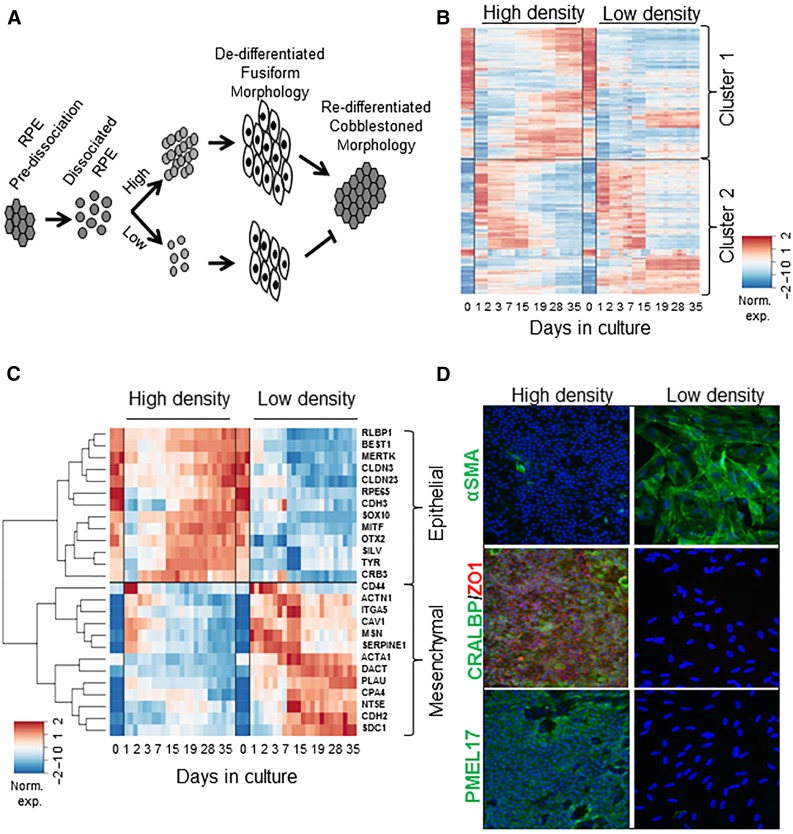
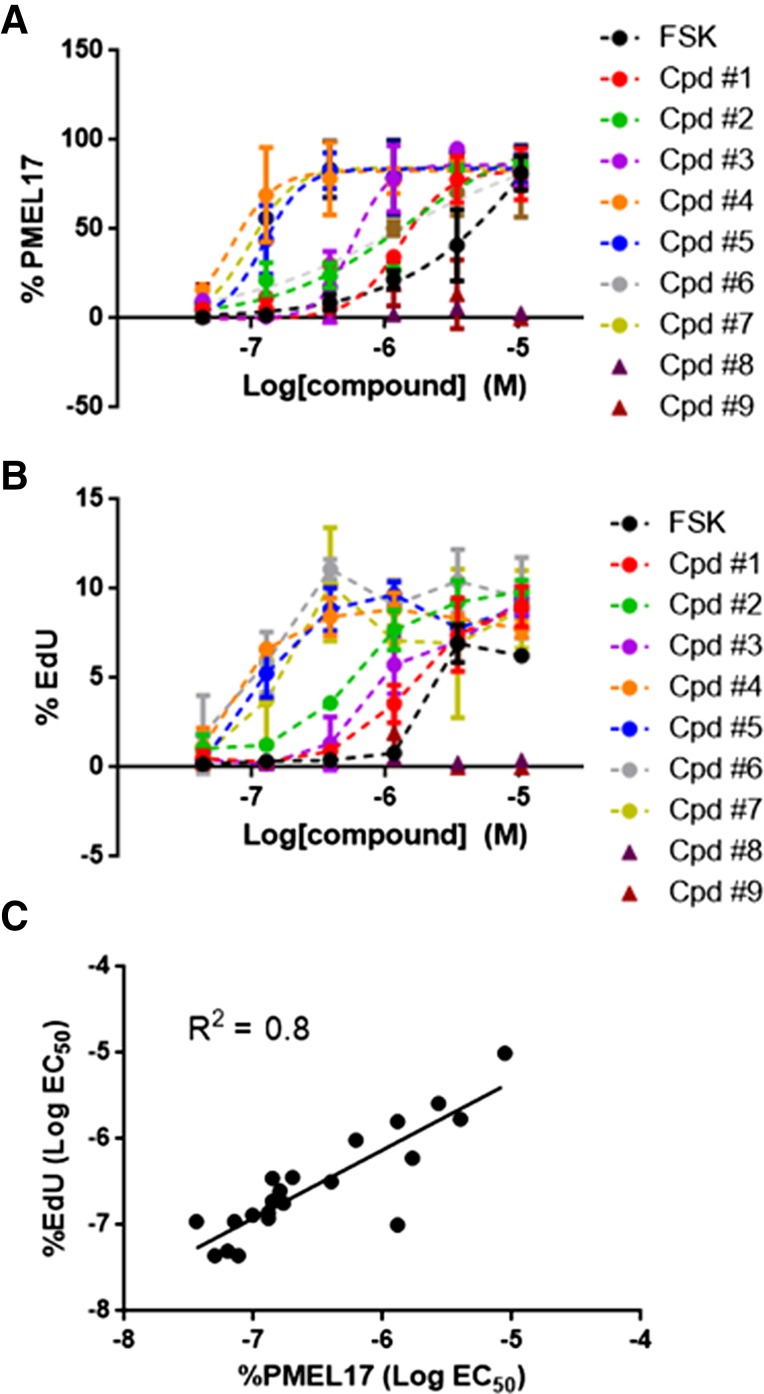
Retinal pigment epithelium (RPE) cell integrity is critical to the maintenance of retinal function. Many retinopathies such as age-related macular degeneration (AMD) are caused by the degeneration or malfunction of the RPE cell layer. Replacement of diseased RPE with healthy, stem cell-derived RPE is a potential therapeutic strategy for treating AMD. Human embryonic stem cells (hESCs) differentiated into RPE progeny have the potential to provide an unlimited supply of cells for transplantation, but challenges around scalability and efficiency of the differentiation process still remain. Using hESC-derived RPE as a cellular model, we sought to understand mechanisms that could be modulated to increase RPE yield after differentiation. We show that RPE epithelialization is a density-dependent process, and cells seeded at low density fail to epithelialize. We demonstrate that activation of the cAMP pathway increases proliferation of dissociated RPE in culture, in part through inhibition of transforming growth factor-β (TGF-β) signaling. This results in enhanced uptake of epithelial identity, even in cultures seeded at low density. In line with these findings, targeted manipulation of the TGF-β pathway with small molecules produces an increase in efficiency of RPE re-epithelialization. Taken together, these data highlight mechanisms that promote epithelial fate acquisition in stem cell-derived RPE. Modulation of these pathways has the potential to favorably impact scalability and clinical translation of hESC-derived RPE as a cell therapy.

Significance: Stem cell-derived retinal pigment epithelium (RPE) is currently being evaluated as a cell-replacement therapy for macular degeneration. This work shows that the process of generating RPE in vitro is regulated by the cAMP and transforming growth factor-β signaling pathway. Modulation of these pathways by small molecules, as identified by phenotypic screening, leads to an increased efficiency of generating RPE cells with a higher yield. This can have a potential impact on manufacturing transplantation-ready cells at large scale and is advantageous for clinical studies using this approach in the future.

Keywords: Proliferation; Retinal pigment epithelium; Stem cells; Transforming growth factor-β; cAMP.


Figures

Figure 1.
Figure 1.
Cell-density dependent effects on re-epithelialization in stem cell-derived RPE. (A): Schematic representation of density-dependent RPE culture where RPE seeded at high density undergo proliferation and successfully epithelialize whereas RPE seeded at low density remain mesenchymal. (B): Heatmap of expression profiles of the top 250 expressed genes ranked by the significance of their expression changes over time in high-density (100,000 cells per cm2) and low-density (8,000 cells per cm2) cultures. Raw expression data are mean centered and scaled to unit variance prior to clustering. The genes cluster into two groups (1 and 2) based on the observed expression pattern. Cluster 1 genes show initial downregulation, whereas cluster 2 genes show initial upregulation upon dissociation and culture. Genes from both clusters return to basal levels with time upon high density seeding but not upon low density seeding. (C): Heatmap showing changes in gene expression of a panel of representative epithelial and mesenchymal markers over a timecourse of RPE culture where cells are seeded as in B. (D): Representative images showing immunocytochemistry for epithelial (CRALBP, ZO1, and PMEL17) and mesenchymal markers (α-SMA) at day 42 in cultures seeded as in B. Images have been captured at ×10 magnification. Abbreviations: ACTN1, actinin-α-1; BEST1, bestrophin 1; CDH2, N-cadherin; CDH3, cadherin 3; CLDN23, claudin 23; CLDN3, claudin 3; CPA4, carboxypeptidase A4; CRALBP, cellular retinaldehyde-binding protein; CRB3, crumbs homolog 3; DACT, Dapper homolog; ITGA5, integrin-α-5; MERTK, Mer receptor tyrosine kinase; MITF, microphthalmia-associated transcription factor; MSN, medium spiny neuron; Norm. exp, normalized expression; OTX2, orthodenticle homeobox 2; PLAU, urokinase plasminogen activator; PMEL17, premelanosome protein 17; RLBP1, retinaldehyde-binding protein 1; RPE, retinal pigment epithelium; SDC1, syndecan 1; SERPIN, serine protease inhibitor; SILV, silver homolog; α-SMA, α-smooth muscle actin; SOX10, SRY-box containing gene 10; TYR, tyrosinase; ZO1, zonula occludens 1.
Figure 2.
Figure 2.
Increasing cAMP signaling promotes acquisition of RPE identity across multiple cell densities. (A): Representative brightfield images showing RPE seeded at multiple densities in the presence or absence of 10 μM forskolin treatment at day 63 in culture. Scale bars = 400 µm. (B): The RPE score (main text) of each sample in the presence (blue) and absence (red) of 10 μM FSK at day 63 is plotted against the seeding density (2.5k, 10k, 15k, 20k, 25k, 27.5k, 30k, and 38k). The shaded area represents 95% confidence intervals, and the solid circles represent biological replicates at the given density. Abbreviations: FSK, forskolin; k, ×1,000 cells per cm2; RPE, retinal pigment epithelium.
Figure 3.
Figure 3.
Gene expression analysis of dbcAMP-treated retinal pigment epithelium (RPE). (A): Principal component analysis of the microarray gene expression data are shown for samples obtained from three different seeding densities (indicated by the shape of each point: circle, 10,000 cells per cm2; square, 20,000 cells per cm2; diamond, 40,000 cells per cm2) in the presence (blue) or absence (red) of dbcAMP. The data from four time points (day 0, 3, 15, and 34 after seeding) is indicated by the shading of each point and the labeled ellipses such that color intensity increases with increasing time in culture. The day 0 samples are indicated as black points and the proportion of the total variance captured by each principal component is indicated in the axis title. This shows that at each time point tested, there is a “doubling effect,” that is, clustering of samples seeded at half the density in the presence of dbcAMP with samples at double the density but without dbcAMP. (B): Heatmap of gene expression levels for the top 1% most variable genes (rows) observed at day 34 in culture. The seeding density and dbcAMP treatment status each sample is indicated by the labels at the bottom of the heatmap. Expression levels are shown mean centered and scaled to unit variance for each gene. Clustering of samples consistent with the doubling effect can be seen. (C): Heatmap of gene expression levels for selected RPE markers across all timepoints, seeding density and dbcAMP treatment is shown. Abbreviations: BEST1, bestrophin 1; D0, day 0; D3, day 3; D15, day 15; D34, day 34; dbcAMP, dibutyryl-cAMP; k, ×1,000 cells per cm2; MITF, microphthalmia-associated transcription factor; RLBP1, retinaldehyde-binding protein 1; SILV, silver homolog; TYR, tyrosinase.
Figure 4.
Figure 4.
dbcAMP increases proliferation of retinal pigment epithelium (RPE) cells. (A): Exemplar Gene Ontology terms, derived from comparison of cultures in the presence vs. absence of dbcAMP at Day34 (20,000 cells per cm2 seeding density), alongside their gene set test significance p values (p < .05). (B): Representative images showing EdU incorporation in the presence or absence of dbcAMP in RPE seeded at 38,000 cells per cm2 at different timepoints in culture. The quantification of EdU incorporation is shown below. Bars represent Mean + SD (n = 8). (C): Representative images showing immunocytochemistry for Ki67 in the presence or absence of 10 μM FSK in RPE seeded at 38,000 cells per cm2 at different timepoints in culture. The quantification of images is shown below. Bars represent mean + SD (n = 3). (D): Representative images showing nuclei stained with DAPI in RPE treated seeded at 38,000 cells per cm2 and cultured for a period of 8 weeks with different periods of exposure to dbcAMP Quantification of cell number, measured by DAPI positive nuclei per frame imaged is shown below. Bars represent mean + SD (n = 3). All images have been captured at ×10 magnification. Abbreviations: 2+6, 2-week dbcAMP+ 6-week media; 3+5, 3-week dbcAMP+ 5-week media; 8, 8-week dbcAMP; D, downregulated; D7, day 7; D14, day 14; D21, day 21; D56, day 56; DAPI, 4′,6-diamidino-2-phenylindole; dbcAMP, dibutyryl-cAMP; EdU, 5-ethynyl-2-deoxyuridine; FDR, false discovery rate; FSK, forskolin; GO, Gene Ontology; U, upregulated.
Figure 5.
Figure 5.
Role of TGF-β signaling in retinal pigment epithelium. (A): Histogram showing change in expression of SMAD3-bound genes in dbcAMP versus control cultures at day 34 (20,000 cells per cm2 seeding density). The frequency of genes is plotted on the y axis and the log fold change is plotted on the x axis such that no change in expression is equivalent to a zero log fold change. The leftward shift of the distribution indicates a significant decrease in expression of SMAD3 responsive genes with dbcAMP treatment. (B): Quantitative polymerase chain reaction-based measurement of transcript expression of a panel of epithelial (CRB3, BEST1, and PMEL) and mesenchymal (CDH2, MMP2, and GREM1) markers in cells seeded at 100,000 cells per cm2 and exposed to 10 ng/ml TGF-β1 for 5 days. ATP5B and CYC1 are used as housekeeping genes. Bars represent mean + SD (n = 3). p < .05 (Student’s t test). (C): Representative images showing immunocytochemistry for indicated markers in cells seeded at high density and exposed to TGF-β1 for 5 days. Images have been captured at ×10 magnification. (D): Quantification of C. Abbreviations: BEST1, bestrophin 1; CDH2, N-cadherin; CRB3, crumbs homolog 3; GREM1, gremlin 1; MMP2, matrix metalloproteinase 2; PMEL, premelanosome protein; PMEL17, premelanosome protein 17; α-SMA, α-smooth muscle actin; TGF-β, transforming growth factor-β.
Figure 6.
Figure 6.
Effect of activin receptor-like kinase 5 (ALK5) inhibitors on retinal pigment epithelium phenotype and proliferation. Cells were seeded at a density of 15,000 cells per cm2 and treated with compounds for 14 days. (A, B): Immunocytochemistry was performed, and dose-response curves were generated measuring percentage of DAPI-positive cells staining positive for PMEL17 (A) and EdU (B). Forskolin was used as the positive control. (C): Correlation between EC50 for both measures for all ALK5 inhibitors screened is shown. Abbreviations: Cpd, compound; EC50, half maximal effective concentration; EdU, 5-ethynyl-2-deoxyuridine; FSK, forskolin; M, molar; PMEL17, premelanosome protein 17; R2, coefficient of determination.
Figure 7.
Figure 7.
Inhibition of TGF-β signaling promotes retinal pigment epithelium phenotype. (A): Quantitative polymerase chain reaction-based measurement of transcript expression of a panel of epithelial (BEST1, PMEL, LRAT, MERTK, RPE65, and RLBP1) and mesenchymal (GREM1) markers in RPE seeded at 5,000 cells per cm2 and treated with 10 μg/ml anti-TGF-β antibody (1D11) for a period of 14 days. Data are normalized to expression of vehicle control. HPRT1 is used as a housekeeping gene. Bars represent mean + SD (n = 3). p < .05 (Student’s t test). (B): Representative images showing immunocytochemistry for indicated markers along with their quantification in cells seeded at 5,000 cells per cm2 and exposed to 10 µg/ml anti-TGF-β for 14 days. Images have been captured at ×10 magnification. Abbreviations: BEST1, bestrophin 1; EdU, 5-ethynyl-2-deoxyuridine; GREM1, gremlin 1; LRAT, lecithin retinol acyltransferase; MERTK, Mer receptor tyrosine kinase; PMEL17, premelanosome protein 17; RLBP1, retinaldehyde-binding protein 1; TGF-β, transforming growth factor-β.

References

    1. Strauss O. The retinal pigment epithelium in visual function. Physiol Rev. 2005;85:845–881. - PubMed
    1. da Cruz L, Chen FK, Ahmado A, et al. RPE transplantation and its role in retinal disease. Prog Retin Eye Res. 2007;26:598–635. - PubMed
    1. Lindekleiv H, Erke MG. Projected prevalence of age-related macular degeneration in Scandinavia 2012-2040. Acta Ophthalmol. 2013;91:307–311. - PubMed
    1. Nazari H, Zhang L, Zhu D, et al. Stem cell based therapies for age-related macular degeneration: The promises and the challenges. Prog Retin Eye Res. 2015;48:1–39. - PubMed
    1. Leach LL, Clegg DO. Concise review: Making stem cells retinal: Methods for deriving retinal pigment epithelium and implications for patients with ocular isease. Stem Cells. 2015;33:2363–2373. - PubMed

MeSH terms