Comparative Study
. 2016 Apr 26:6:25001.
doi: 10.1038/srep25001.

Alteration of the serum microbiome composition in cirrhotic patients with ascites

Affiliations
Comparative Study

Alteration of the serum microbiome composition in cirrhotic patients with ascites

Alba Santiago et al. Sci Rep. .

Abstract

The progression of cirrhosis is associated with alterations in the composition of the gut microbiome. To assess microbial translocation, we compared the serum microbial composition of patients with and without ascites and characterized the ascitic fluid microbiome using 16S rDNA high-throughput sequencing data. A complex and specific microbial community was detected in the serum and ascitic fluid of patients with cirrhosis but barely detectable in the serum of healthy controls. The serum microbiome of patients with ascites presented higher levels of lipopolysaccharide binding protein, a marker of microbial translocation, associated with higher diversity and relative abundance of Clostridiales and an unknown genus belonging to the Cyanobacteria phylum compared to patients without ascites. The composition of the fecal microbiome was also more altered in patients with than without ascites, confirming previous studies on fecal microbiome. We propose that alteration of the serum and fecal microbiome composition be considered indicators of cirrhosis progression.


Figures

Figure 1
Figure 1. Fecal microbiome of cirrhotic patients and healthy controls.
(a,b) Healthy controls presented higher microbial diversity compared to all cirrhotic patients (a) and to patients with and patients without ascitic fluid (b) as assessed by the Chao1 index. The two groups of patients with and without ascites were not significantly different. (c,d) Unweighted UniFrac PcoA (c) and weighted UniFrac UPGMA (d) clustering analysis. Blue: healthy controls; orange: patients without ascites; and red: patients with ascites. (e,f) Relative abundance of microbes differentially present at the species level between healthy controls and all cirrhotic patients (e) and between healthy controls and cirrhotic patients with ascites (f) (Kruskal-Wallis; FDR < 0.05). Analyses were performed on 16 S rRNA V4 region data, obtained from stool samples, rarefied to a depth of 19,930 reads per sample. Healthy controls (n = 17); patients (n = 27); patients with ascites (n = 13); patients without ascites (n = 14); ***P = 0.001; **P = 0.003.
Figure 2
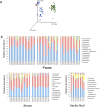
Figure 2. Fecal, serum and ascitic fluid microbiome.
(a) Clustering of samples using unweighted UniFrac PcoA representation. (b) Taxonomic composition at the phylum level of the three sample types: Feces, serum, and ascitic fluid. Analyses were performed on 16 S rRNA V4 region data, rarefied to a depth of 19,930 reads for stool and 1,000 reads for serum and ascitic fluid samples. Green: stool; blue: serum; red: ascitic fluid. F.H = Feces of healthy controls; F.P = Feces of patients with cirrhosis; S.Q.P = Serum of patients; AF.P = ascitic fluid of patients. 201 to 215 = patients without ascites; 101 to 113 = patients with ascites.
Figure 3
Figure 3. Microbial of extra-intestinal sites and marker of translocation.
(a) Alpha-diversity of the microbial fluid samples as assessed by Chao1 index of diversity. Ascitic fluid (n = 11); Serum of patients with cirrhosis (n = 19; instead of 27 due to rarefaction depth with ascitic fluid samples). (b) Higher alpha-diversity of serum microbiome of cirrhotic patients with ascites compared to that of patients without (P < 0.05). Analyses were performed on 16 S rRNA V4 region data, rarefied to a depth of 1,000 reads per sample. (c) Lipopolysaccharide binding protein (LBP) levels as assessed by specific ELISA; serum of patients with ascites (n = 11 available samples).
Figure 4
Figure 4. Serum microbiome of patients with and without ascites.
(a) UPGMA clustering based on unweighted UniFrac metric of serum samples of cirrhotic patients with and without ascites. (b) Relative abundance of microbes or groups of microbes significantly different between serum microbiome of cirrhotic patients with and without ascites. Analyses were performed on 16S rRNA V4 region data, rarefied to a depth of 1,000 reads per sample.

References

    1. Mokdad A. A. et al. Liver cirrhosis mortality in 187 countries between 1980 and 2010: a systematic analysis. BMC Med 12, 145 (2014). - PMC - PubMed
    1. Macnaughtan J. & Jalan R. Clinical and Pathophysiological Consequences of Alterations in the Microbiome in Cirrhosis. Am J Gastroenterol 110, 1399–1410 (2015). - PubMed
    1. Bajaj J. S. et al. Altered profile of human gut microbiome is associated with cirrhosis and its complications. J Hepatol 60, 940–947 (2014). - PMC - PubMed
    1. Qin N. et al. Alterations of the human gut microbiome in liver cirrhosis. Nature 513, 59–64 (2014). - PubMed
    1. Bajaj J. S., Betrapally N. S. & Gillevet P. M. Decompensated cirrhosis and microbiome interpretation. Nature 525, E1–2 (2015). - PMC - PubMed

Publication types