. 2016 May 4;90(3):609-21.
doi: 10.1016/j.neuron.2016.03.033. Epub 2016 Apr 21.

Oxytocin Enhances Social Recognition by Modulating Cortical Control of Early Olfactory Processing

Affiliations

Oxytocin Enhances Social Recognition by Modulating Cortical Control of Early Olfactory Processing

Lars-Lennart Oettl et al. Neuron. .

Abstract

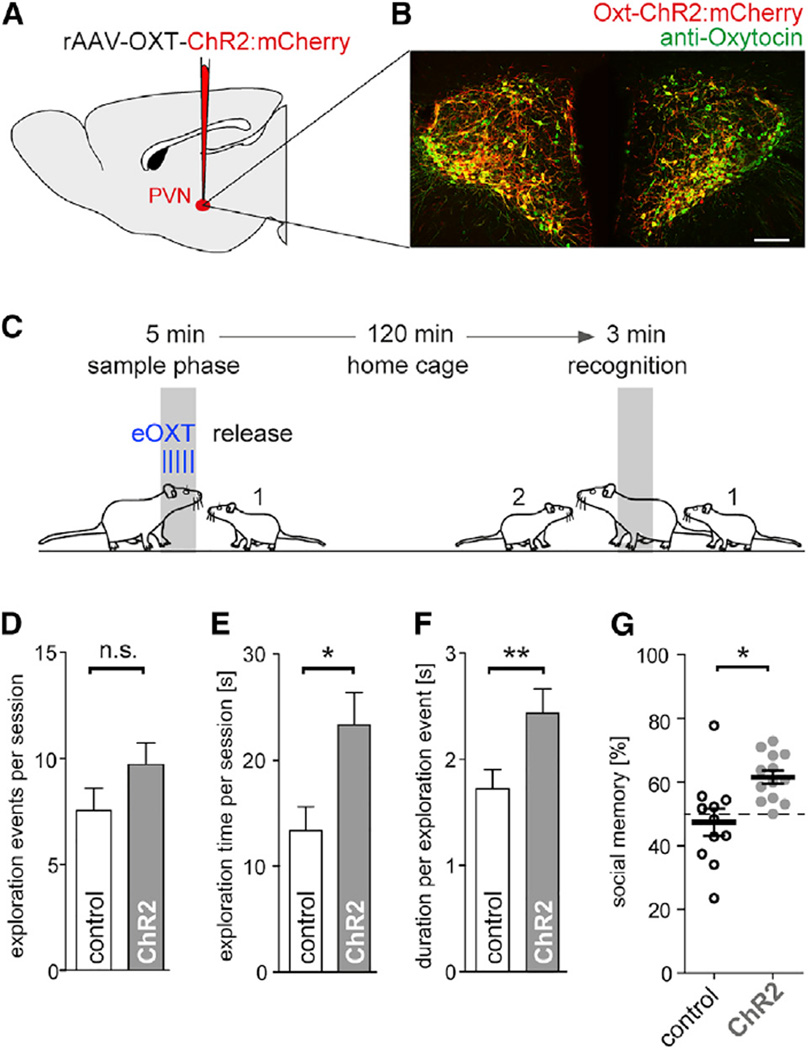
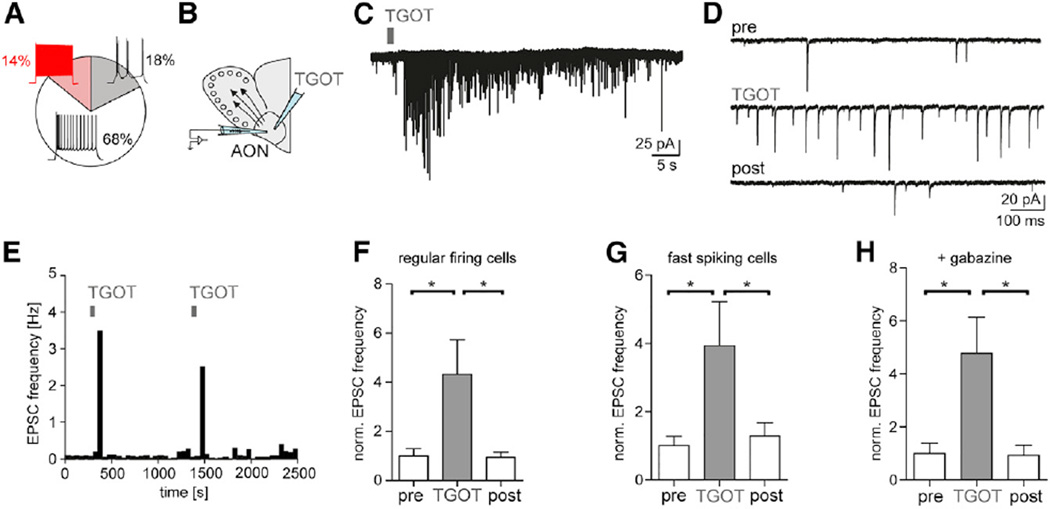
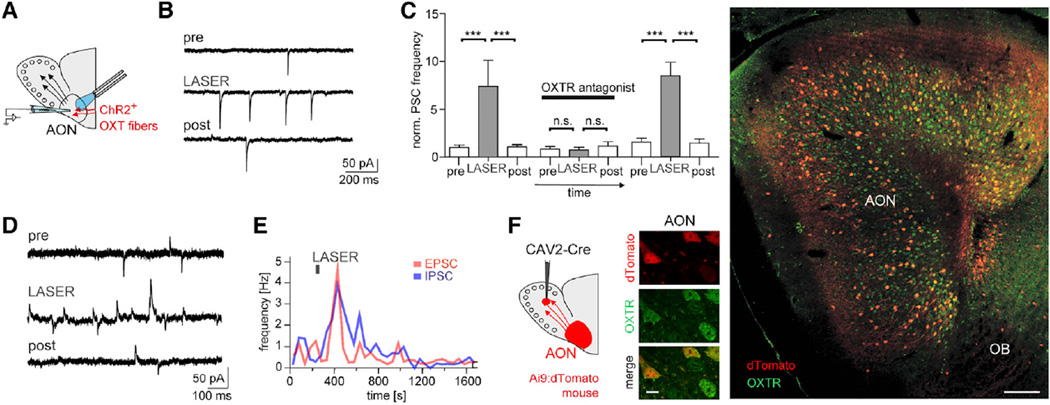
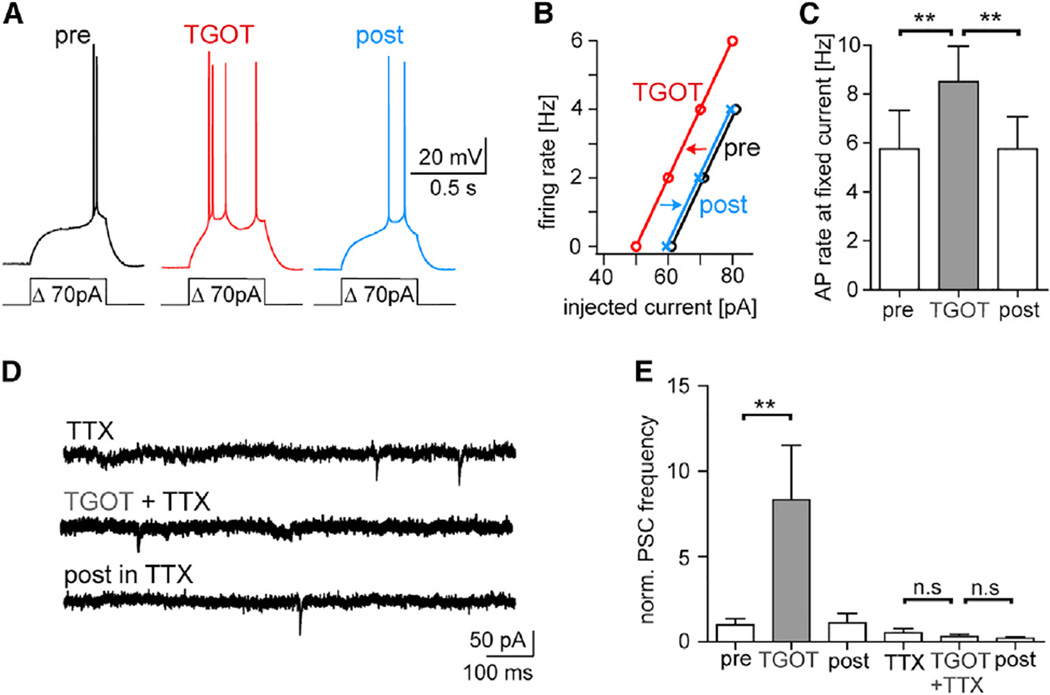
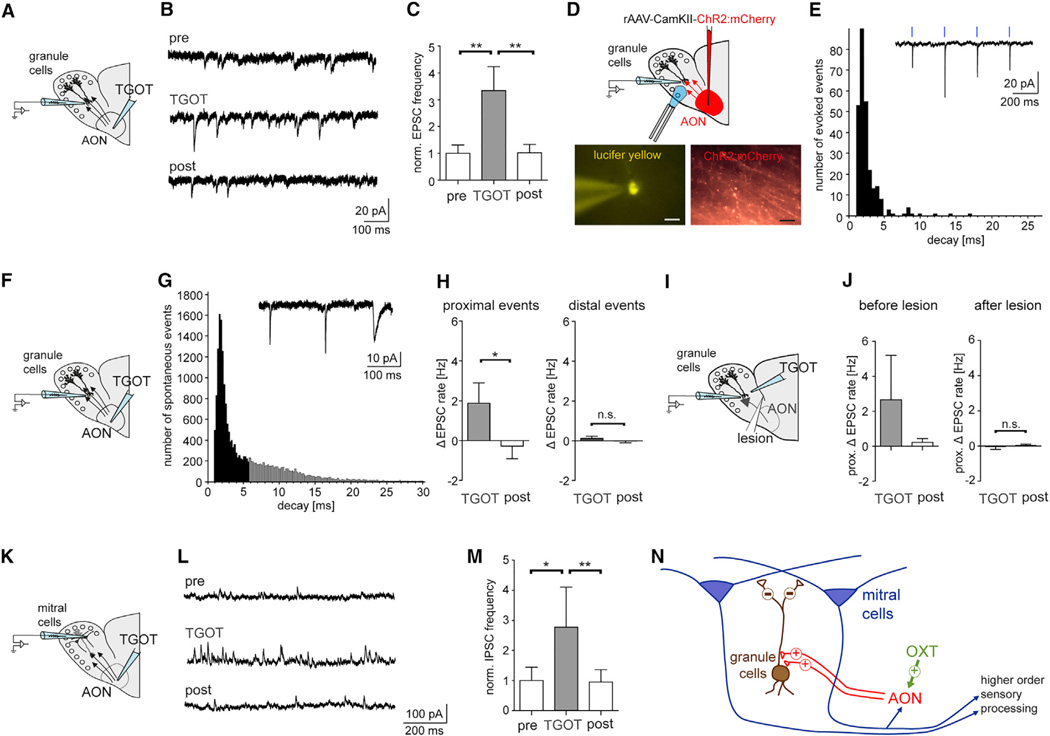
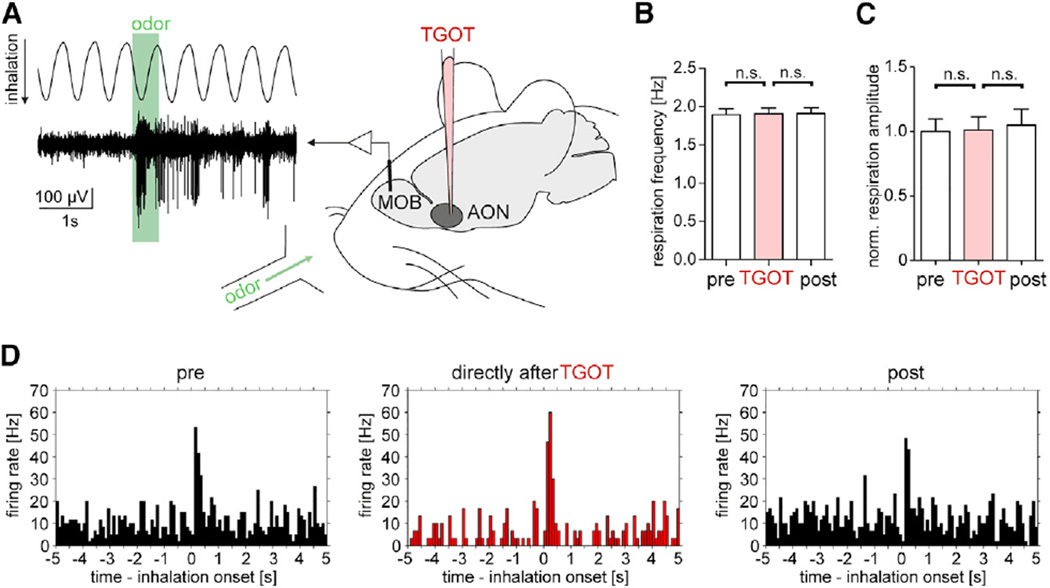
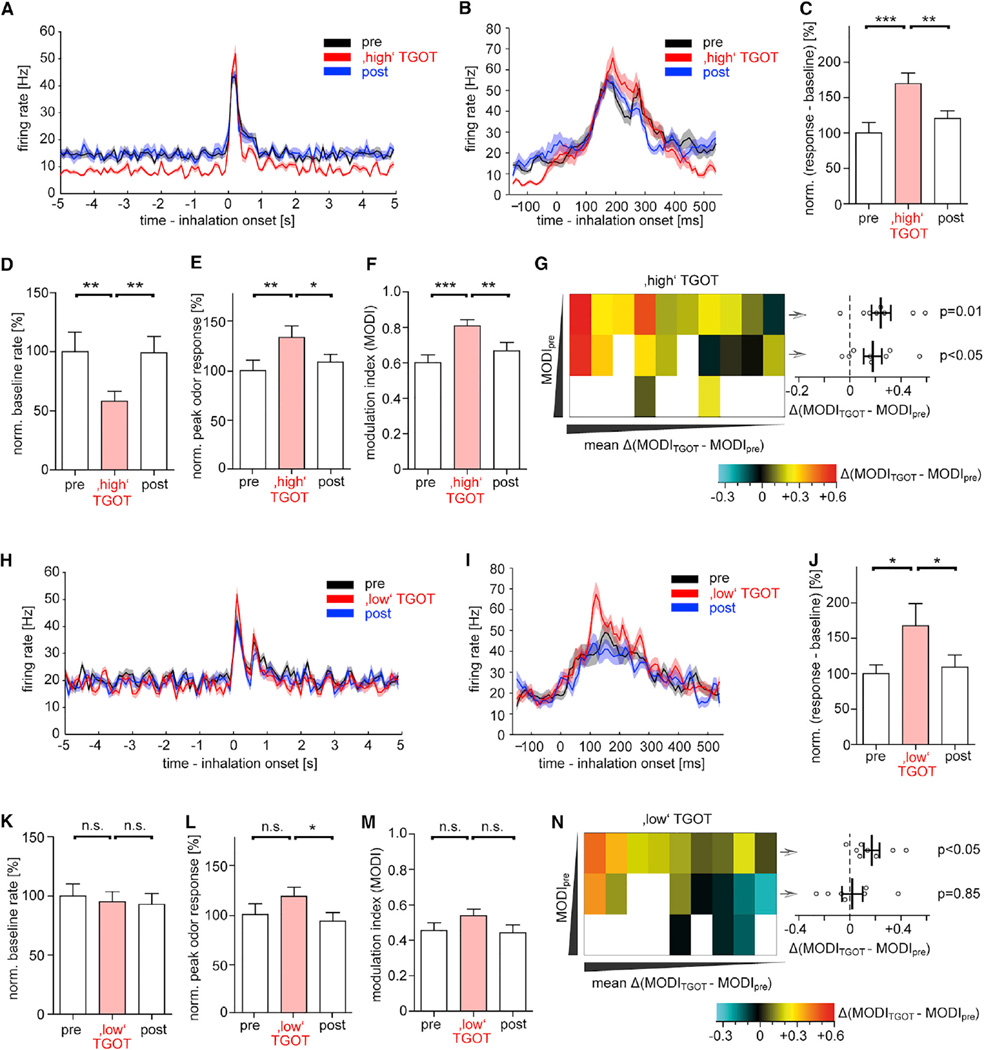
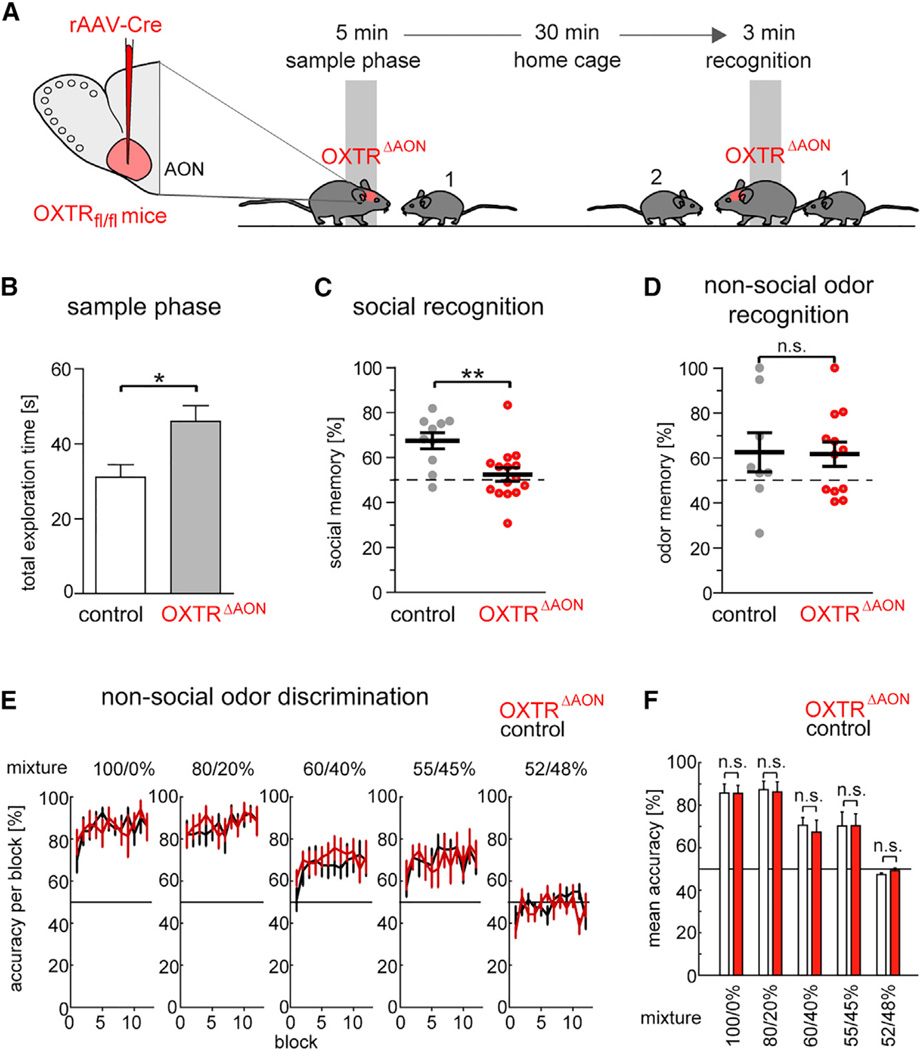
Oxytocin promotes social interactions and recognition of conspecifics that rely on olfaction in most species. The circuit mechanisms through which oxytocin modifies olfactory processing are incompletely understood. Here, we observed that optogenetically induced oxytocin release enhanced olfactory exploration and same-sex recognition of adult rats. Consistent with oxytocin's function in the anterior olfactory cortex, particularly in social cue processing, region-selective receptor deletion impaired social recognition but left odor discrimination and recognition intact outside a social context. Oxytocin transiently increased the drive of the anterior olfactory cortex projecting to olfactory bulb interneurons. Cortical top-down recruitment of interneurons dynamically enhanced the inhibitory input to olfactory bulb projection neurons and increased the signal-to-noise of their output. In summary, oxytocin generates states for optimized information extraction in an early cortical top-down network that is required for social interactions with potential implications for sensory processing deficits in autism spectrum disorders.

Keywords: anterior olfactory nucleus; centrifugal; granule cells; mitral cells.


Figures

Figure 1
Figure 1. Evoked OXT Release Enhances Exploration and Recognition of Same-Sex Conspecifics
(A) To optogenetically evoke OXT release, we injected an AAV expressing ChR2:mCherry under the control of an OXT promoter fragment, rAAV1/2-OXT-ChR2:mCherry, or a control virus, rAAV1/2-OXT-GFP, bilaterally into the PVN. (B) Expression of ChR2:mCherry in the PVN and colocalization with OXT immunoreactivity (scale bar, 150 µm; see also Figure S1). (C) For the social recognition test, adult female rats were exposed for 5 min to a same-sex juvenile rat (sample phase). After return to the home cage, the adult rat was re-exposed to the previous and, at the same time, to a novel same-sex juvenile for 3 min (recognition phase). (D–F) Total number of anogenital exploration events (D), total duration of anogenital exploration (E), and average duration of single anogenital exploration events (F) that 13 ChR2+ or 11 control GFP+ adult rats performed on the juvenile during the 5 min sample phase (*p < 0.05, **p < 0.01, t test). (G) Social recognition memory was expressed as the percentage of time the test animal spent exploring the novel social partner over the total time exploring both same-sex interaction partners for 13 ChR2+ or 11 control GFP+ adult rats during the 3 min recognition phase (*p < 0.05, t test). All data reported as mean ± SEM.
Figure 2
Figure 2. OXTR Activation in the AON Increases the Excitatory Drive
(A) Distribution of 85 neurons with different firing patterns upon intracellular current injection in the AON. (B) The selective OXTR agonist TGOT (1 µM) was puff applied to the AON. (C and D) TGOT increased the rate of sEPSCs in a regular-firing neuron at Vh = −60 mV displayed at low (C) and higher temporal resolution (D). (E) Peristimulus time histogram (PSTH) showed reversible sEPSC rate increases following repeated TGOT application in a regular-firing neuron. (F) sEPSC rate reversibly increased in 12 AON regular-firing cells following TGOT application. In this and subsequent figures, PSC frequencies were normalized by dividing the PSC rates of the displayed condition by the initial baseline rate (200 s). (G) TGOT-induced normalized sEPSC rate increases were also observed in six fast-spiking neurons. For burst-firing cells, see Figure S3E. (H) TGOT still increased normalized sEPSC rate in presence of the GABAAR antagonist, gabazine (10 µM; n = 4), in regular-firing neurons. For (F)–(H), p < 0.05, ANOVA with posttest indicated *p < 0.05. All data reported as mean ± SEM.
Figure 3
Figure 3. Endogenous OXT Release Also Increases the Excitatory Drive in the AON
(A) In rats expressing ChR2:mCherry in OXT terminals, OXT release was evoked by a burst of blue laser light (30 Hz for 2–20 s). (B) Laser stimulation resulted in increases of the sEPSC rate in a regular-firing neuron at Vh = −60 mV. (C) The increase in normalized sPSC rate following repeated laser stimulation was reversibly blocked by the OXTR antagonist OTA (1 µM, n = 6) (p < 0.05, ANOVA with posttest indicated ***p < 0.001). (D and E) Simultaneous increases in inward sEPSC and outward sIPSC rate following laser stimulation at Vh = —60 mV(D), and PSTH of the time course of the simultaneous rate increases for a single stimulation in a regular-firing neuron (E). (F) Retrograde viral labeling of AON neurons following injection of CAV2-Cre into the MOB of Ai9 reporter mice for dTomato, and immunoreactivity for the OXTR (green) in the AON at low and high magnification (scale bar, 10 and 150 µm, respectively). All data reported as mean ± SEM.
Figure 4
Figure 4. OXTR Activation Increases the Intrinsic Excitability of AON Regular-Firing Neurons
(A) Spike rate transiently increased following application of the OXTR agonist (“TGOT”) in presence of CNQX (10 µM), D-AP5 (50 µM), and gabazine (10 µM). The resting membrane potential did not change through TGOT (see Figure S4). (B) The input-output function for current injection versus spike rate of the cell shown in (A) displayed a reversible parallel shift to the left. (C) Comparison of the respective spike rate to the same current injection directly after (TGOT) or 5 min after TGOT application (post) (n = 8). (D) The fast sodium channel blocker TTX (1 µM) blocked the TGOT-induced sEPSC rate increase in a regular-firing neuron at Vh = −60 mV. (E) In seven regular-firing neurons, TGOT evoked an increase of normalized PSCs that disappeared in presence of TTX. For (C) and (E), p < 0.05, ANOVA with posttest indicated **p < 0.01. All data reported as mean ± SEM.
Figure 5
Figure 5. OXTR Activation in the AON Increases Excitatory Drive to GCs and Inhibitory Drive to Mitral Cells in the MOB
(A) The selective OXTR agonist TGOT (1 µM) was puff applied to the AON during recordings from GCs in the MOB. (B) Recording of sEPSCs (Vh = −60 mV) in a GC. (C) TGOT reversibly increased the sEPSC rate in seven GCs (p < 0.05, ANOVA with posttest indicated **p < 0.01). (D) Glutamatergic top-down projections from the AON to the MOB expressed ChR2:mCherry following injection of rAAV1/2-CamKII-ChR2:mCherry in the AON. GCs were filled with Lucifer yellow during recordings (scale bar, 10 µm). (E) Laser stimulation elicited time-locked EPSCs with fast decay time constants in three GCs at Vh = −60 mV. (F) TGOT was applied to the AON during GC recordings. (G) sEPSCs were plotted in the histogram, with fast sEPSCs (decay < 6 ms) indicated as black bars. (H) Analysis of sEPSC decay time constants revealed a selective rate increase of fast (proximal), but not slow (distal), sEPSCs (n = 7 GCs, *p < 0.05, t test). (I) TGOT actions were probed before and after lesioning the projections between the AON and MOB. (J) TGOT elicited a rate increase of fast sEPSCs. After cutting connection between the AON and MOB, the TGOT response for EPSC rate changes was lost while the baseline rate of sEPSCs was unchanged (n = 5 GCs). (K) TGOT was applied to the AON during recordings from mitral cells. (L) Recording of sIPSCs (Vh = −60 mV) in a mitral cell. (M) TGOT application to the AON elicited a reversible normalized sIPSC rate increase in seven mitral cells at Vh = −60 mV (p < 0.05, ANOVA with posttest indicated *p < 0.05, **p < 0.01). (N) Scheme summarizing OXT actions in the AON and MOB. All data reported as mean ± SEM.
Figure 6
Figure 6. OXTR Activation in the AON Modifies M/TC Firing in the MOB
(A) Experimental setup and example of an extracellular single-unit recording in the MOB of an anesthetized rat. Odorants were applied for 0.5 s and respiration was monitored simultaneously. TGOT (1.6 µM, 1 µL) was applied through a glass micropipette to the AON. (B and C) Respiration frequency (B) and normalized amplitude (C) did not change with TGOT application in AON (n = 10 recordings) (n.s., ANOVA). (D) PSTH of M/TC unit firing in response to the same odorant (0.5 s) and effect of TGOT application to AON. Data aligned to sniff onset (bin size, 100 ms) (cf. Figure S6G). All data reported as mean ± SEM.
Figure 7
Figure 7. OXTR Activation in the AON Increases Signal-to-Noise Ratios of Odor Responses in M/TCs
(A and B) Average firing rate modulation by the “high” TGOT dose (1 µL of 1.6 µM) in ten M/TCs. Odor-evoked responses increased after TGOT application in AON, whereas baseline firing was reduced. Data were aligned to first inhalation after odor onset with bin sizes of 100 ms (A) or 10 ms (B). (C) The normalized difference between peak odor response and baseline rate increased upon high TGOT application in 20 cell-odor pairs (p < 0.05, ANOVA). (D) The normalized baseline firing rates of M/TCs decreased following high TGOT in 20 cell-odor pairs (p < 0.05, ANOVA). (E) Normalized peak odor-evoked responses were determined as maximum firing rates of the respective cells within a 100 ms bin within 1 s after odor onset and its increase through high TGOT in 20 cell-odor pairs (p < 0.05, ANOVA). (F) The modulation index (MODI) increased through high TGOT in the 20 cell-odor pairs (p < 0.05, ANOVA). (G) Heat map of the Δ(MODITGOT − MODIpre) for the 20 cell-odor pairs from the high TGOT sample. Three different odorants had been applied throughout the experiment to each cell. Odors that did not elicit a response in that cell were marked in white. For each cell, odors were ranked according to their increasing MODIpre from top to bottom. Then cells were ranked according to their mean Δ(MODITGOT − MODIpre) from left to right. Right graph: in the eight cells that responded to more than one odor, Δ(MODITGOT − MODIpre) increased both for odors with the lowest and next higher MODIpre of each cell (one sample t test), and the increase was similar between the two groups (p = 0.3, t test). With all ten cells included for the respective lowest MODIpre Δ(MODITGOT − MODIpre) = 0.24 ± 0.06 (p<0.001, one sample t test). (H and I) Average firing rate modulation by the low TGOT dose (1 µL of 0.5 µM) in nine M/TCs. Data were aligned to first inhalation after odor onset with bin sizes of 100 ms (H) or 10 ms (I). (J) The normalized difference between peak odor response and baseline rate increased upon low TGOT application in 19 cell-odor pairs (p < 0.05, ANOVA). (K) The normalized baseline firing rates of M/TCs did not decrease following low TGOT in 19 cell-odor pairs (n.s., ANOVA). (L) Normalized peak odor-evoked responses increased through low TGOT in 19 cell-odor pairs (p < 0.05, ANOVA). (M) The change in the modulation index (MODI) through low TGOT did not reach significance for all 19 cell-odor pairs pooled (p = 0.09, ANOVA). (N) Heat map of Δ(MODITGOT − MODIpre) for the 19 cell-odor pairs from the low TGOT sample. Right graph: in the seven cells that responded to more than one odor, Δ(MODITGOT − MODIpre) increased only for odors with the lowest MODIpre (one sample t test), and the increase was larger for the lowest than the next higher MODIpre (p < 0.05, t test). With all nine cells included for the respective lowest MODIpre, Δ(MODITGOT − MODIpre) = 0.19 ± 0.04 (p = 0.002, one sample t test). In (C)–(F) and (K)–(N), posttest was indicated *p<0.05, **p<0.01, ***p<0.001. All data reported as mean ± SEM.
Figure 8
Figure 8. Impaired Same-Sex Social Recognition in Mice Following OXTR Deletion in the AON
(A) Scheme of social recognition test. Male mice were placed with an unknown juvenile for 5 min. After a 30 min interval in the home cage, they were placed with the same juvenile and a second unknown juvenile for 3 min. To generate OXTRΔAON mice, rAAV1/2-CBA-Cre was injected in the AON of mice in which the OXTR gene was flanked by loxP sites. Control mice received the same virus injection but had two wild-type OXTR alleles. (B) Total exploration time of social partners during the initial sample phase was longer in 15 OXTRΔAON than in 10 control mice (*p < 0.05, t test). (C) Social recognition memory was expressed as the percentage of exploration time of the new juvenile mouse over the total time exploring both interaction partners for 15 OXTRΔAON and 10 control mice (**p < 0.01, t test). (D) In an analogous test for nonsocial odors, recognition memory was determined as the percent of exploration time of a new odorant over the total time exploring both odorants for 13 OXTRΔAON and 8 control mice (n.s., t test). (E) Animals were first exposed to pure odorants (“100%”) and then between pairs of increasingly similar mixtures (for instance, 80% (+)-carvone/ 20% (−)-carvone versus 20% (+)-carvone/80% (−)-carvone). Mean percentage of correct responses in each block of 10 trials (120 trials per session) for the carvone enantiomers in 7 control and 8 OXTRΔAON mice. A score of 50% corresponds to expected performance at chance level. (F) Genotype differences determined from the average performance in each session of the odor discrimination (excluding the first 20 trials) for the 7 control and 8 OXTRΔAON mice (all t tests p > 0.44). All data reported as mean ± SEM.

Comment in

Similar articles

Cited by

References

    1. Alonso M, Lepousez G, Sebastien W, Bardy C, Gabellec MM, Torquet N, Lledo PM. Activation of adult-born neurons facilitates learning and memory. Nat. Neurosci. 2012;15:897–904. - PubMed
    1. American Psychiatric Association. Diagnostic and Statistical Manual of Mental Disorders. Fifth. American Psychiatric Association; 2013.
    1. Angelo K, Rancz EA, Pimentel D, Hundahl C, Hannibal J, Fleischmann A, Pichler B, Margrie TW. A biophysical signature of network affiliation and sensory processing in mitral cells. Nature. 2012;488:375–378. - PMC - PubMed
    1. Asperger H. Die autistischen psychopathen im kindesalter. Arch. Psychiatr. Nervenkr. 1944;177:76–136.
    1. Balu R, Strowbridge BW. Opposing inward and outward conductances regulate rebound discharges in olfactory mitral cells. J. Neurophysiol. 2007;97:1959–1968. - PubMed

Publication types