. 2016 Apr 26:6:24956.
doi: 10.1038/srep24956.

Human somatic cells subjected to genetic induction with six germ line-related factors display meiotic germ cell-like features

Affiliations

Human somatic cells subjected to genetic induction with six germ line-related factors display meiotic germ cell-like features

Jose V Medrano et al. Sci Rep. .

Abstract

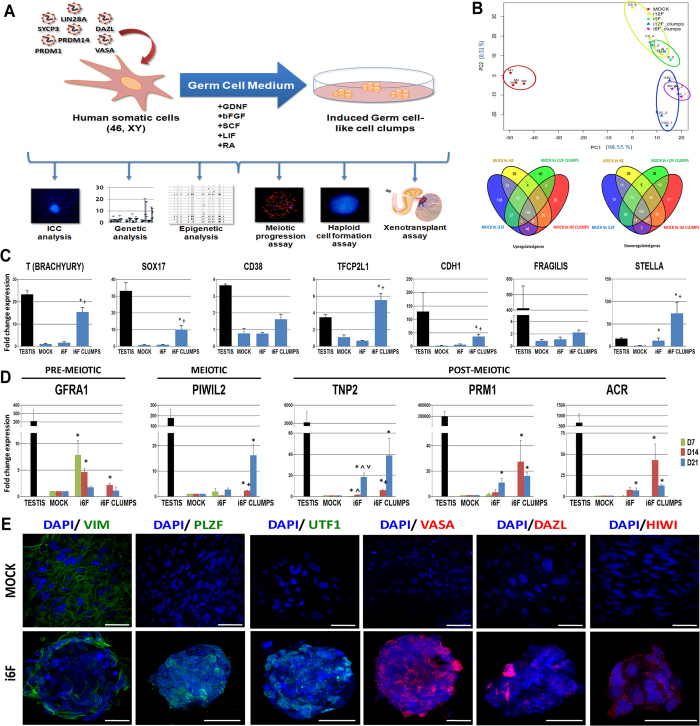
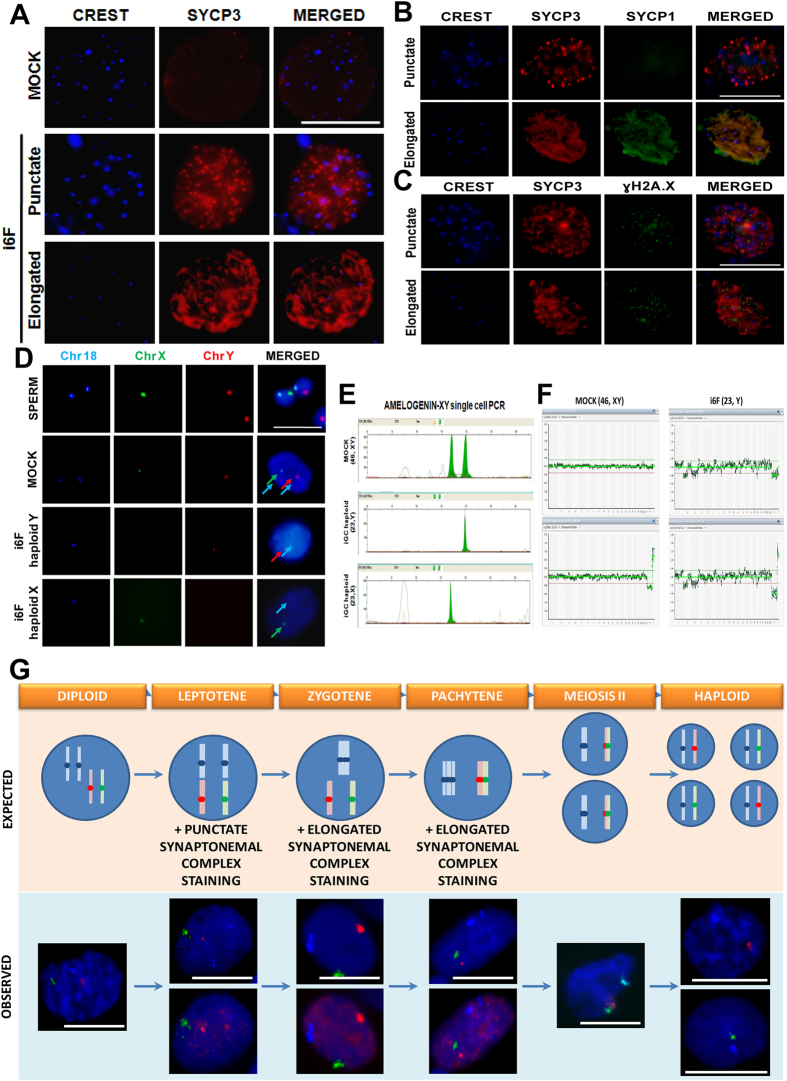
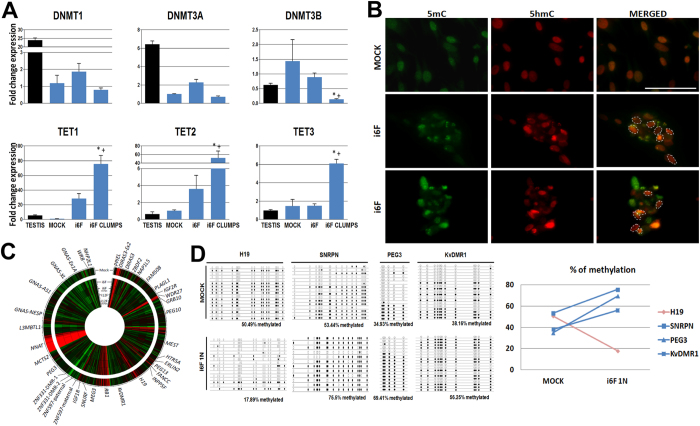
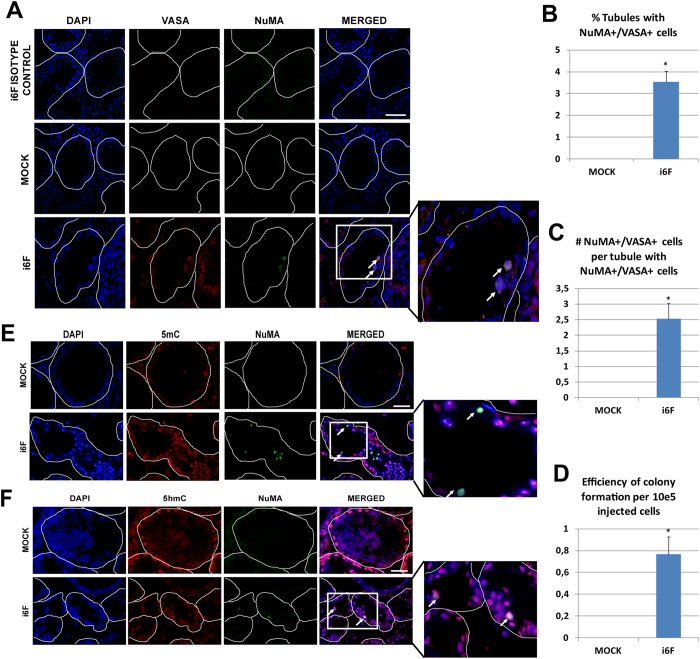
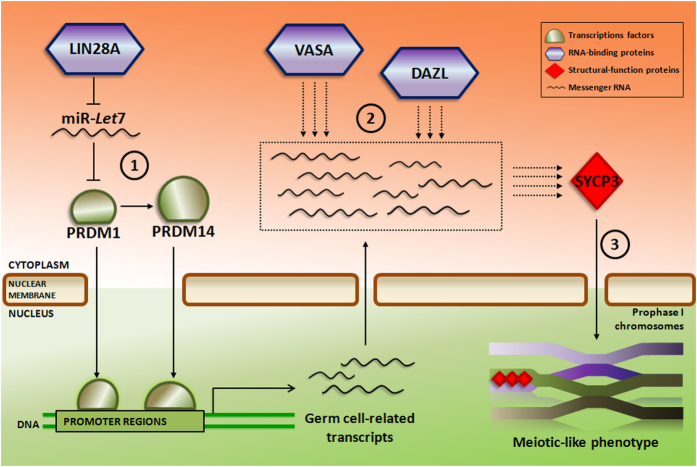
The in vitro derivation of human germ cells has attracted interest in the last years, but their direct conversion from human somatic cells has not yet been reported. Here we tested the ability of human male somatic cells to directly convert into a meiotic germ cell-like phenotype by inducing them with a combination of selected key germ cell developmental factors. We started with a pool of 12 candidates that were reduced to 6, demonstrating that ectopic expression of the germ line-related genes PRDM1, PRDM14, LIN28A, DAZL, VASA and SYCP3 induced direct conversion of somatic cells (hFSK (46, XY), and hMSC (46, XY)) into a germ cell-like phenotype in vitro. Induced germ cell-like cells showed a marked switch in their transcriptomic profile and expressed several post-meiotic germ line related markers, showed meiotic progression, evidence of epigenetic reprogramming, and approximately 1% were able to complete meiosis as demonstrated by their haploid status and the expression of several post-meiotic markers. Furthermore, xenotransplantation assays demonstrated that a subset of induced cells properly colonize the spermatogonial niche. Knowledge obtained from this work can be used to create in vitro models to study gamete-related diseases in humans.


Figures

Figure 1
Figure 1. Characterization of induced fibroblasts (hFSKs).
(A) Schematic diagram of the experimental setup of the study. (B) Principal Component Analyses and Venn diagrams of up- and down-regulated genes when compared MOCK, i12F and i6F- induced hFSKs all together (n = 5). (C) RT-qPCR expression analysis of human PGC markers over i6F induced hFSK cells. (D) RT-qPCR expression analysis of the germ line markers GFRA1, PIWIL2, TNP2, PRM1, and ACR over i6F induced hFSK cells at 7 (D7), 14 (14D) and 21 (21D) days post-transduction (n = 8). Human testis cDNA physiological expression fold change relative to MOCK samples is also shown as a control. (E) Illustrative pictures of immunofluorescencent stainings for VIM, PLZF, UTF1, VASA, DAZL and HIWI over MOCK and i6F clumps from hFSK cells. Data is presented as normalized fold change mean +/− SEM. (*) represent significant differences (p < 0.05) with MOCK controls; (+) represents significant differences (p < 0.05) between i12F/i6F conditions and their respective clumps; (∧) represent significant differences (p < 0.05) with day 7 expression within sample groups; (∨) represent significant differences (p < 0.05) with day 14 expression within sample groups. Scale bar represents a distance of 50 μm.
Figure 2
Figure 2. Meiotic progression analysis 14 days post-transduction of fibroblasts.
(A) Illustrative pictures of the SYCP3 staining pattern over i6F transduced hFSK cells. (B) SYCP3 and SYCP1 co-localization over transduced cells indicates effective chromosomal synapsis. (C) SYCP3 and ɣH2A.X co-localization over transduced cells indicates putative DSB loci. (D) Representative FISH results for probes against chromosomes 18 (aqua), X (green) and Y (red) over 1N sorted cells. (E) Molecular assessment of the ploidy in single cells. PCR products of the Amelogenin gene results in a peak of 118pb for the copy in X and a 124pb peak for the copy in Y. (F) Illustrative aCGH results of a diploid (46, XY) cell from MOCK and a haploid (23, Y) cell from i6F, co-hybridized with male (upper panels) and female (lower panels) diploid references. (G) Combined SYCP3 staining and FISH analysis reveals that meiotic-like cells recapitulate all the stages of the meiosis. The upper section shows the expected pattern of centromeric probes for the chromosomes 18, X and Y over meiotic cells. The bottom section shows representative pictures of the combined SYCP3 stainning (dark red) and FISH analysis corresponding to each of the meiotic sub-stages. In diploid cells, the expected FISH pattern in (46, XY) cells is 2 aqua signals: 1 green signal: 1 red signal (2:1:1), and any SYCP3 staining. During leptotene, cells show a FISH pattern 2:1:1, with a punctate SYCP3 staining. Since zygotene is a transitional sub-stage until homologue chromosomes are totally paired, both 1:1:1 and 2:1:1 FISH patterns are possible, co-localizing with an elongated SYCP3 staining. In pachytene, totally paired homologue chromosomes show a FISH pattern 1:1:1 with overlap of X and Y signals in the bivalent structure and an elongated SYCP3 staining. After the first reductional meiotic division, the synaptonemal complex is undetectable and nuclei show a 1:1:1 FISH pattern with overlapped X and Y signals. Finally, after the second equational meiotic division, haploid cells can either show a 1:0:1 or a 1:1:0 FISH pattern. Data is presented as mean +/− SEM. (**) represent significant differences (p < 0.01) with MOCK controls. Scale bar represents a distance of 10 μm.
Figure 3
Figure 3. Epigenetic characterization of the in vitro induced fibroblasts.
(A) RT-qPCR expression analysis of the DNA methyl-transferases DNMT1, DNMT3A and DNMT3B, and the TET-mediated de-methylases TET1, TET2 and TET3 over i6F induced fibroblasts 14 days post-transduction (n = 3). Human testis cDNA physiological expression fold change relative to MOCK samples is also shown as a control. Data is presented as normalized fold change mean +/− SEM. (*) represent significant differences (p < 0.05) with controls; (+) represents significant differences (p < 0.05) between i6F whole culture condition and i6F clumps. (B) Representative pictures of the co-localization of 5-methyl-Cytosine (5mC) and 5-hydroxi-methyl-Cytosine (5hmC) over MOCK cells and i6F clumps at 14 days post-transduction. Dashed lines indicate cell nuclei enriched for 5hmC (red) in MOCK control (0/15 nuclei in the picture) and in two illustrative pictures of i6F clumps (7/17 nuclei (41.1%) and 5/18 nuclei (27.7%), respectively) compared with the 5mC signal (green). Scale bar represents a distance of 10 μm. (C) Circular heat map presentation of the methylation for 37 annotated human imprinted loci in induced fibroblasts 14 days post-transduction (n = 3). (D) Bisulphite sequencing results at 14 days post-transduction at the DMR of the H19, SNRPN, PEG3 and KvDMR1 loci in putative 1N sorted i6F cells (n = 3). Diagrams represent methylation status of each CpG dinucleotide on individual DNA clones. Lines represent different clones and columns are different CpG dinucleotides. Methylated CpGs are represented as filled circles and unmethylated CpGs are represented as open circles. Empty CpG sites represent the CpGs that could not be determined. In the graph, blue line indicates the methylation change in the analyzed maternally imprinted loci, whereas pink line indicates the methylation change observed for the paternally imprinted loci H19.
Figure 4
Figure 4. Germ cell xenotransplant results.
(A) Illustrative pictures showing NuMA+/VASA+co-localization on the basal layer of germ cell depleted seminiferous tubules in MOCK and i6F transplanted testis. (B) Percentage of tubules containing NuMA+/VASA+ cells. (C) Average number of NuMA+/VASA+ cells per tubule showing colonizing cells. (D) Efficiency of colonization per 10e5 injected cells in i6F transplanted testis (n = 5 testes). (E) Illustrative pictures showing NuMA/5mC co-localization and (F) NuMA/5hmC co-localization in transplanted testis. Data is presented as mean +/− SEM. Periphery of tubule cross-sections are highlighted by dashed lines. White arrows indicate colonizing human cells. Scale bar represents a distance of 50 μm.
Figure 5
Figure 5. Proposed model for the germ line conversion and meiotic induction by i6F.
The repressing effect of the RNA-binding protein LIN28A over the miRNA Let-7 allows that the transcription factors PRDM1 and PRDM14 bind to their specific genomic targets and switch on a germ line transcription program that generates a pool of mRNA transcripts (1). On the other hand, the RNA-binding proteins DAZL and VASA control the meiotic entry of the germ cell-like induced cells thanks to their regulatory functions over the pool of mRNA transcripts (2), at the same time that they (or probably other downstream translated proteins) organize the meiotic prophase I through the structural protein of the synaptonemal complex SYCP3 (3).

Similar articles

Cited by

References

    1. Stephen E. H. & Chandra A. Declining estimates of infertility in the United States: 1982–2002. Fertil Steril 86, 516–523 (2006). - PubMed
    1. West J. A. et al.. A role for Lin28 in primordial germ-cell development and germ-cell malignancy. Nature 460, 909–913 (2009). - PMC - PubMed
    1. Saitou M., Barton S. C. & Surani M. A. A molecular programme for the specification of germ cell fate in mice. Nature 418, 293–300 (2002). - PubMed
    1. Hajkova P. et al.. Epigenetic reprogramming in mouse primordial germ cells. Mech Dev 117, 15–23 (2002). - PubMed
    1. Clark A. T. et al.. Spontaneous differentiation of germ cells from human embryonic stem cells in vitro. Hum Mol Genet 13, 727–739 (2004). - PubMed

Publication types