. 2016 Apr 26:6:24965.
doi: 10.1038/srep24965.

The utility of DNA metabarcoding for studying the response of arthropod diversity and composition to land-use change in the tropics

Affiliations

The utility of DNA metabarcoding for studying the response of arthropod diversity and composition to land-use change in the tropics

Kingsly Chuo Beng et al. Sci Rep. .

Abstract

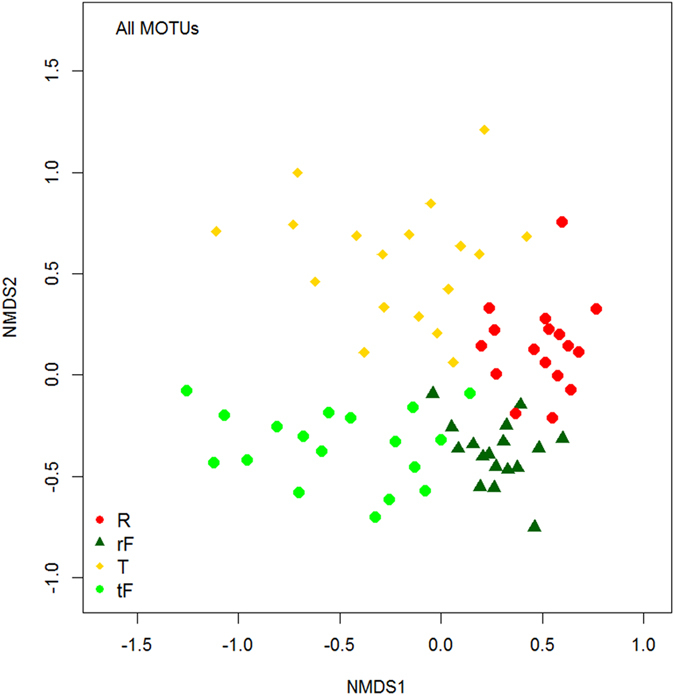
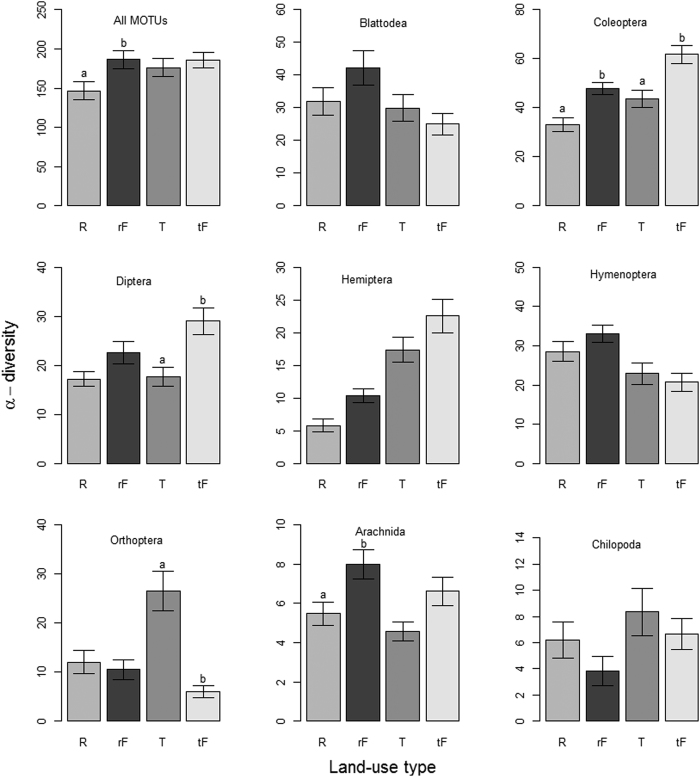
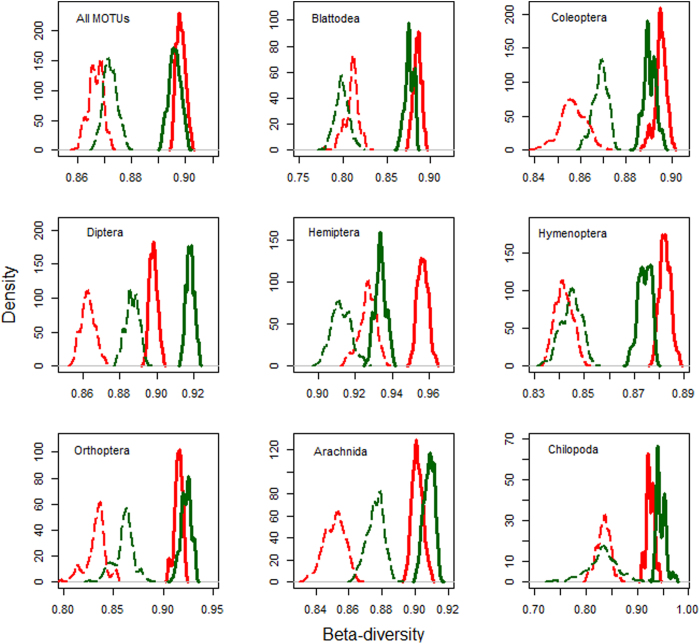
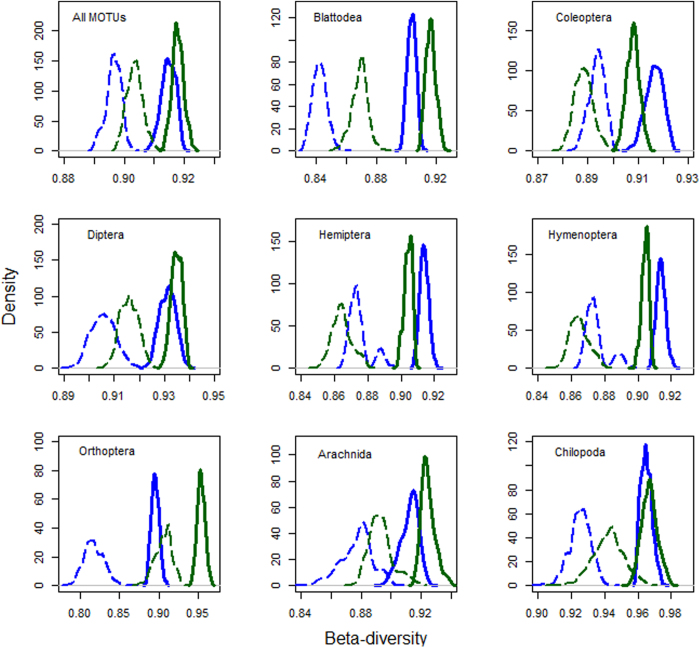
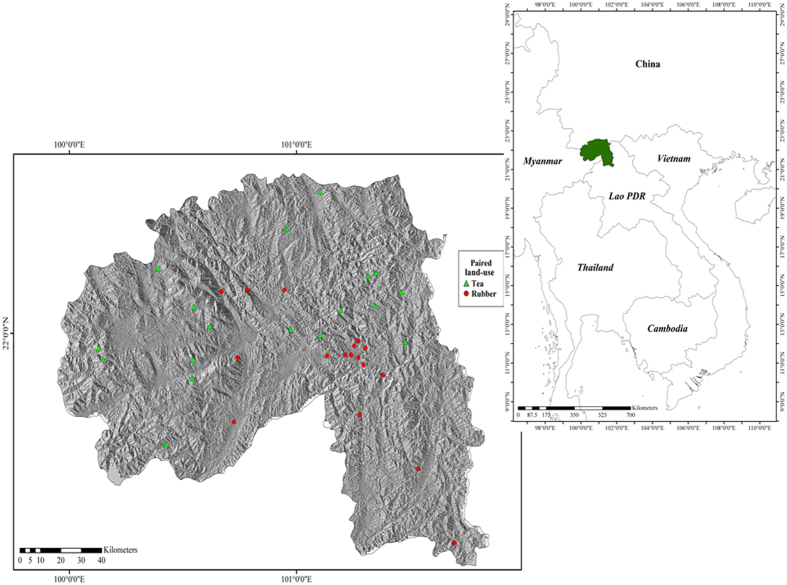
Metabarcoding potentially offers a rapid and cheap method of monitoring biodiversity, but real-world applications are few. We investigated its utility in studying patterns of litter arthropod diversity and composition in the tropics. We collected litter arthropods from 35 matched forest-plantation sites across Xishuangbanna, southwestern China. A new primer combination and the MiSeq platform were used to amplify and sequence a wide variety of litter arthropods using simulated and real-world communities. Quality filtered reads were clustered into 3,624 MOTUs at ≥97% similarity and the taxonomy of each MOTU was predicted. We compared diversity and compositional differences between forests and plantations (rubber and tea) for all MOTUs and for eight arthropod groups. We obtained ~100% detection rate after in silico sequencing six mock communities with known arthropod composition. Ordination showed that rubber, tea and forest communities formed distinct clusters. α-diversity declined significantly between forests and adjacent plantations for more arthropod groups in rubber than tea, and diversity of order Orthoptera increased significantly in tea. Turnover was higher in forests than plantations, but patterns differed among groups. Metabarcoding is useful for quantifying diversity patterns of arthropods under different land-uses and the MiSeq platform is effective for arthropod metabarcoding in the tropics.


Figures

Figure 1
Figure 1. Ordination (nMDS) plot illustrating the similarities and differences in MOTU composition across four land-use types.
R = rubber, T = tea, while rF and tF = forest matched with rubber and tea, respectively.
Figure 2
Figure 2. Comparison of α-diversity (mean ± s.e.m.) in matched forest-plantation sites for all MOTUs and eight arthropod orders.
All tests are based on Kruskal–Wallis followed by Mann–Whitney post-hoc comparisons with Bonferroni correction. Significant differences between pairs [R vs. rF and T vs tF] are indicated with different lowercase characters (a, b). R = rubber, T = tea, while rF and tF = forest matched with rubber and tea, respectively.
Figure 3
Figure 3. Total β-diversity (smooth lines) and turnover (broken lines) for rubber-forests [green lines] versus rubber [red lines] sites.
These were computed using 1000 bootstrap samples of 15 sites from each land use type. Significant differences between pairs are detected when the peaks of the density plots do not overlap with each other.
Figure 4
Figure 4. Total β-diversity (smooth lines) and turnover (broken lines) for tea-forests [green lines] versus tea [blue lines] sites.
These were computed using 1000 bootstrap samples of 15 sites from each land use type. Significant differences between pairs are detected when the peaks of the density plots do not overlap with each other.
Figure 5
Figure 5. Location of Xishuangbanna (XSBN) in Yunnan province, China and in Southeast Asia (right; green) and paired sample sites where arthropods were collected (left).
The green triangles represent forest-tea paired sites and the red circles represent forest-rubber paired sites. The regional map (China, Cambodia, Lao PDR, Myanmar, Thailand and Vietnam) was generated using the TM_world_borders_3 dataset freely available from the thematic mapping website (http://thematicmapping.org/downloads/world_borders.php). The prefecture (XSBN) map was generated using the freely available level three (provincial) maps from Divagis spatial data (http://www.diva-gis.org/; Hijmans, R. J., L. Guarino, C. Bussink, P. Mathur, M. Cruz, I. Barrentes, and E. Rojas. 2004. DIVA-GIS. Version. 5.0. A geographic information system for the analysis of species distribution data). Background data shows the slope aspect, generated from the Shuttle Radar Topography Mission (SRTM) 1 Arc-Second Global using the “aspect” tool in ArcMap 10.1 (ESRI 2015. ArcGIS Desktop: Release 10.1. Redlands, CA: Environmental Systems Research Institute; http://desktop.arcgis.com/en/arcmap/). Points were downloaded from a hand-held GPS (GPSMAP® 62s | Garmin) before being digitized and uploaded as a shapefile.

References

    1. Laurance W. F., Sayer J. & Cassman K. G. Agricultural expansion and its impacts on tropical nature. Trends Ecol Evol 29, 107–116, 10.1016/j.tree.2013.12.001 (2014). - DOI - PubMed
    1. Corlett R. T. The Anthropocene concept in ecology and conservation. Trends Ecol Evol 30, 36–41, 10.1016/j.tree.2014.10.007 (2015). - DOI - PubMed
    1. Wang J. Z. et al. A framework for the assessment of the spatial and temporal patterns of threatened coastal delphinids. Sci Rep-Uk 6, Artn 1988310.1038/Srep19883 (2016). - PMC - PubMed
    1. Souza J. L. P. et al. Taxonomic sufficiency and indicator taxa reduce sampling costs and increase monitoring effectiveness for ants. Divers Distrib 22, 111–122, 10.1111/ddi.12371 (2016). - DOI
    1. Ji Y. Q. et al. Reliable, verifiable and efficient monitoring of biodiversity via metabarcoding. Ecol Lett 16, 1245–1257, 10.1111/ele.12162 (2013). - DOI - PubMed

Publication types

LinkOut - more resources