. 2016 Dec 15;524(18):3729-3746.
doi: 10.1002/cne.24027. Epub 2016 May 17.

Prolonged corticosterone exposure induces dendritic spine remodeling and attrition in the rat medial prefrontal cortex

Affiliations

Prolonged corticosterone exposure induces dendritic spine remodeling and attrition in the rat medial prefrontal cortex

Rachel M Anderson et al. J Comp Neurol. .

Abstract

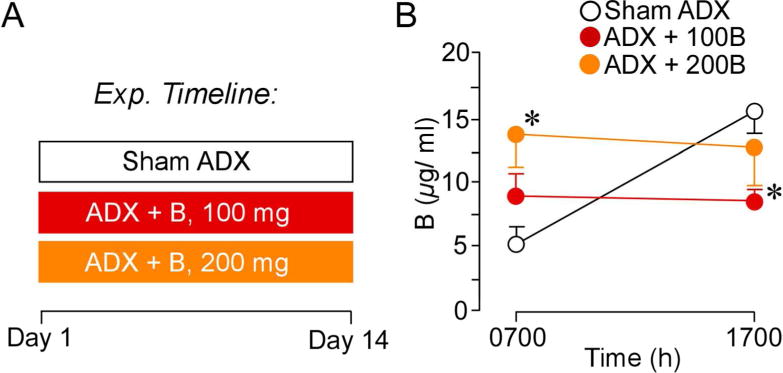
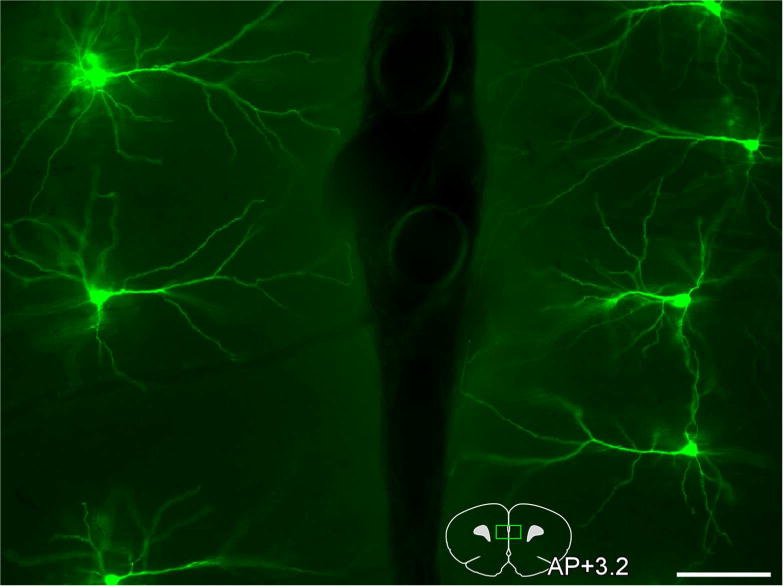
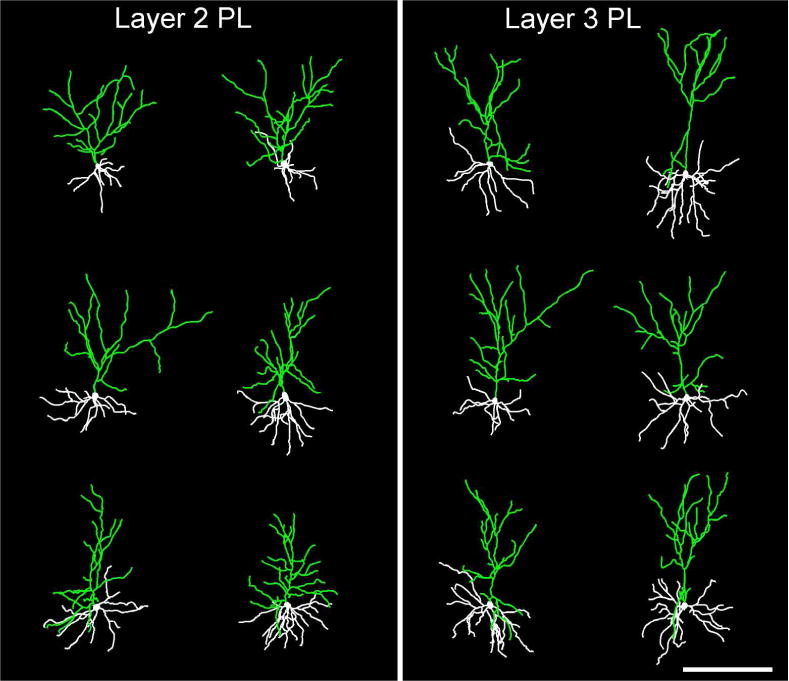
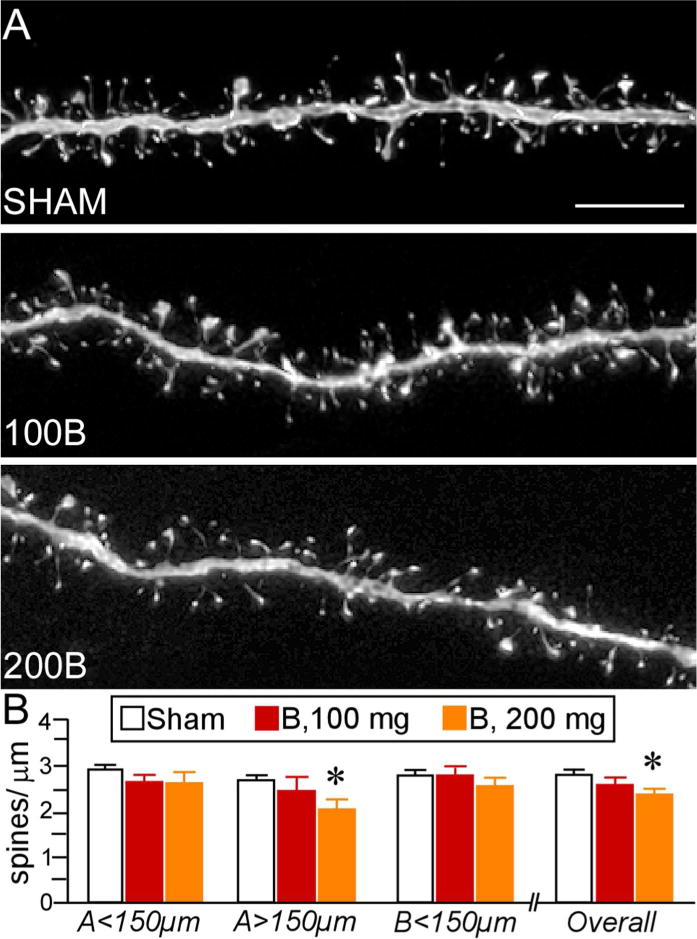
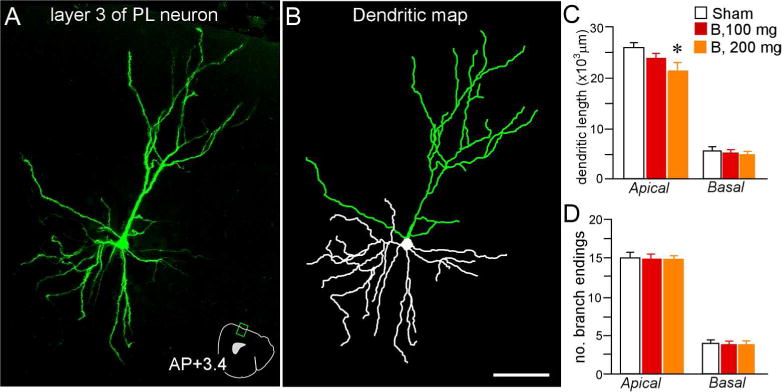
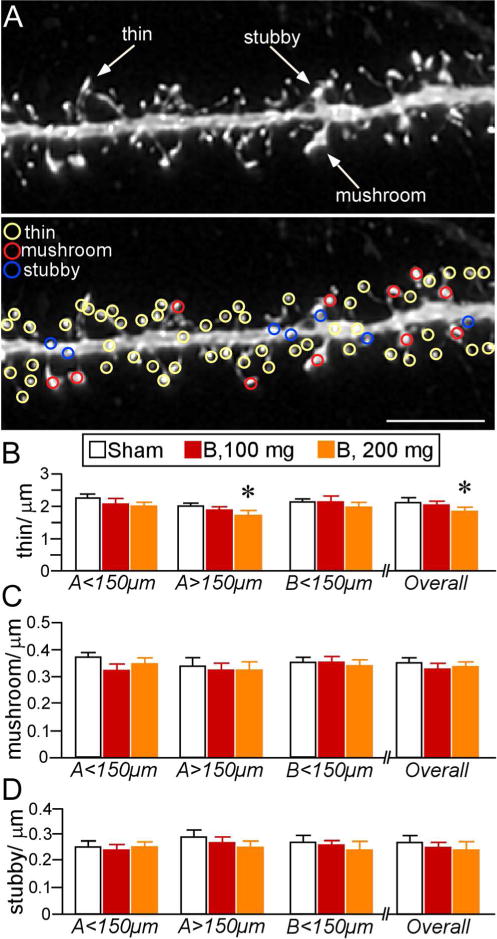
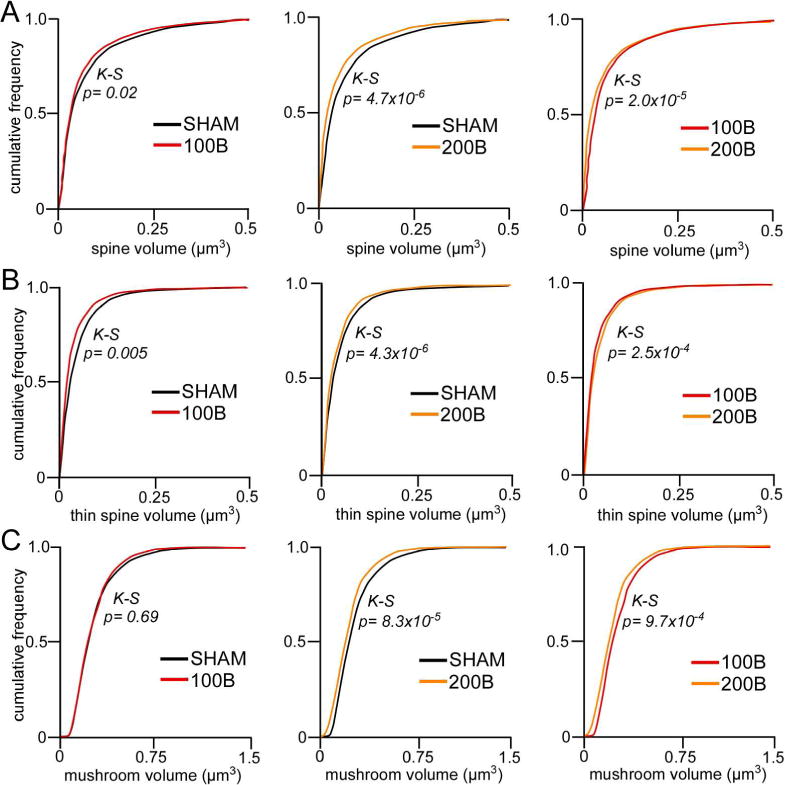
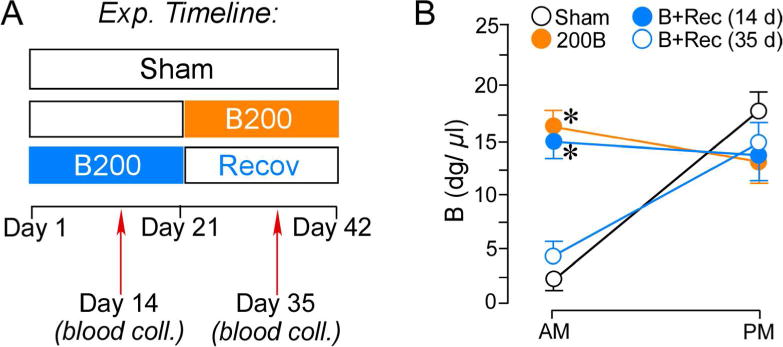
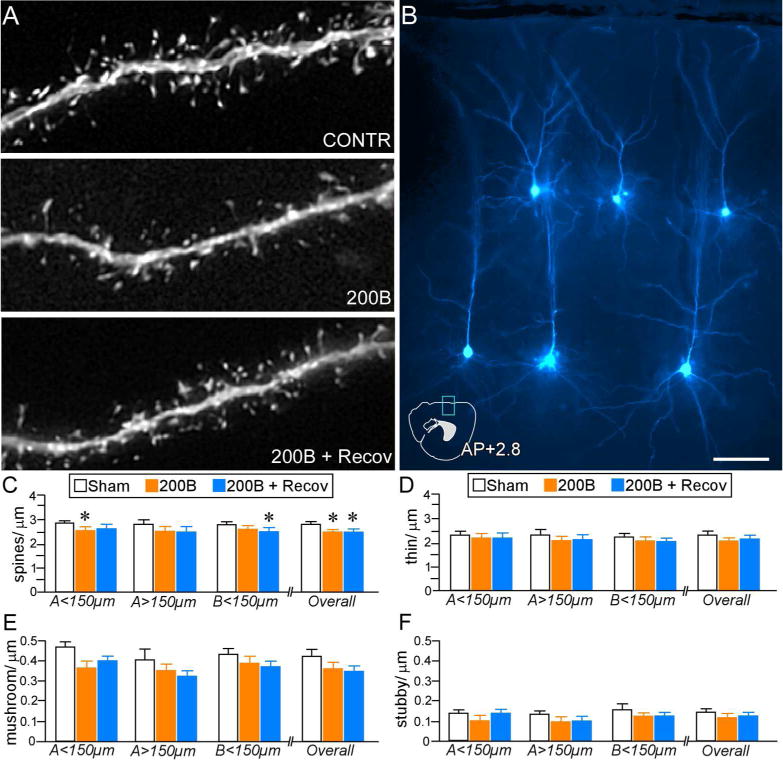
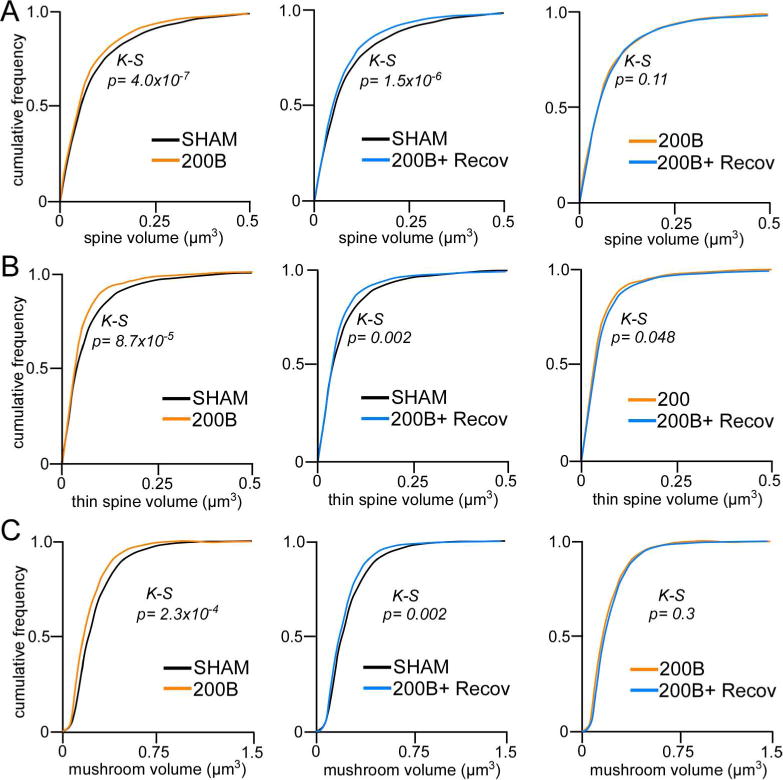
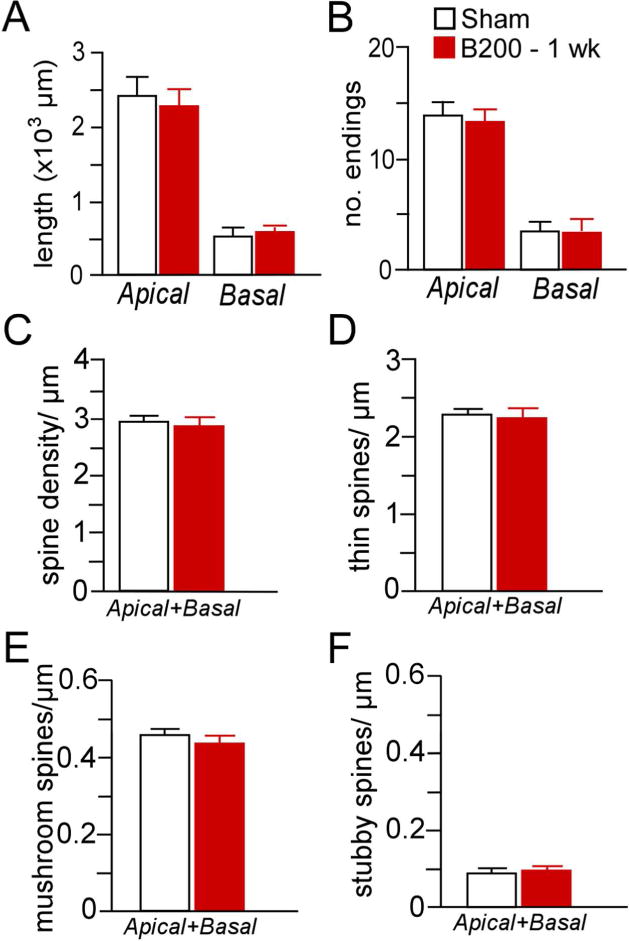
The stress-responsive hypothalamo-pituitary-adrenal (HPA) axis plays a central role in promoting adaptations acutely, whereas adverse effects on physiology and behavior following chronic challenges may result from overactivity of this system. Elevations in glucocorticoids, the end-products of HPA activation, play roles in adaptive and maladaptive processes by targeting cognate receptors throughout neurons in limbic cortical networks to alter synaptic functioning. Because previous work has shown that chronic stress leads to functionally relevant regressive alterations in dendritic spine shape and number in pyramidal neurons in the medial prefrontal cortex (mPFC), this study examines the capacity of sustained increases in circulating corticosterone (B) alone to alter dendritic spine morphology and density in this region. Subcutaneous B pellets were implanted in rats to provide continuous exposure to levels approximating the circadian mean or peak of the steroid for 1, 2, or 3 weeks. Pyramidal neurons in the prelimbic area of the mPFC were selected for intracellular fluorescent dye filling, followed by high-resolution three-dimensional imaging and analysis of dendritic arborization and spine morphometry. Two or more weeks of B exposure decreased dendritic spine volume in the mPFC, whereas higher dose exposure of the steroid resulted in apical dendritic retraction and spine loss in the same cell population, with thin spine subtypes showing the greatest degree of attrition. Finally, these structural alterations were noted to persist following a 3-week washout period and corresponding restoration of circadian HPA rhythmicity. These studies suggest that prolonged disruptions in adrenocortical functioning may be sufficient to induce enduring regressive structural and functional alterations in the mPFC. J. Comp. Neurol. 524:3729-3746, 2016. © 2016 Wiley Periodicals, Inc.

Keywords: HPA axis; NeuronStudio; confocal laser-scanning microscopy; glucocorticoids; prelimbic.


Conflict of interest statement

The authors declare no competing financial interests.

Figures

Figure 1
Figure 1
A. Timeline of the first experiment. On day 1 animals underwent ADX surgeries and B pellet implantation or sham ADX and cholesterol pellet implantation. On day 14 blood was collected to assay for effectiveness of pellet increasing B levels. B. Graph depicting mean ± SEM plasma CORT levels at AM and PM sampling of B as a function of treatment group. These data reveal that 200 mg B pellets clamp levels to peak circadian levels, while 100 mg B pellets clamp B levels to values approximating the circadian mean. N = 10, control; N = 6, B100 and B200. *, p< 0.05, significantly different from sham-treated animals.
Figure 2
Figure 2
Darkfield photomicrograph depicting an array of bilateral layer 2 and 3 pyramidal neurons in PL targeted for intracellular dye-injection with Lucifer Yellow (pseudo-colored green). An atlas plate (lower right) depicts the approximate region within PL that neurons were filled for morphologic analyses. Distance in millimeters relative to bregma is indicated. AP, anteroposterior. Scale bar, 100 μm.
Figure 3
Figure 3
Examples of 3D digital reconstructions showing Lucifer Yellow-filled layer 2 (left) and layer 3 (right) pyramidal neurons in PL. Contrasting apical dendritic morphologies between these neuronal subtypes are highlighted in green, with layer 3 neurons exhibiting apical dendrites with and initial bifurcation point more distal to the cell body than in layer 2. Scale bar, 200 μm.
Figure 4
Figure 4
A. Deconvolved images of dendritic segments from layer 2 and 3 pyramidal neurons in PL from different treatment groups. Scale bar, 5 μm. B. Mean + SEM of dendritic spine density as a function of B treatment. B100 animals showed no differences in spine density relative to controls within any region of the dendritic tree. B200 rats displayed overall spine loss, notably in the more distal aspects of the apical tree. N = 10, control; N = 6, B100 and B200. *, p< 0.05, significantly different from sham rats.
Figure 5
Figure 5
3D digital reconstruction (A) of a Lucifer Yellow-filled layer 2 and 3 PL neuron (pseudocolored green) using confocal laser-scanning microscopy, and the rendering of its dendritic tree (B) using computer-assisted morphometry. An atlas plate (A, lower right) depicts the neuron’s approximate location and angle of orientation within PL. Distance in millimeters relative to bregma is indicated. AP, anteroposterior Scale bar (applies to both), 75 μm. Mean + SEM for dendritic length (C) and number of branch endings (D) for apical and basal dendrites as a function of treatment group. Only rats that received high-dose glucocorticoids (B, 200 mg) displayed apical dendritic shrinkage. N = 10, control; N = 6, B100 and B200. *, p< 0.05, significantly different from sham rats.
Figure 6
Figure 6
A. Example of high-resolution deconvolved optical z-stack of a dendritic segment used for spine analysis with NeuronStudio Software. Open colored circles designate spine subtypes based upon user-defined parameters in the software. Scale bar, 5 μm. B–D. Mean ± SEM of dendritic spine subtypes. B. Thin spine loss was evident in B200 rats, especially at radial distances > 150 μm. No other effects were evident in other subtypes (C, D). N = 10, control; N = 6, B100 and B200. *, p < 0.05, significantly different from sham rats.
Figure 7
Figure 7
A. Cumulative frequency distributions of overall spine volume in PL neurons reveal graded leftward shifts (i.e. decrease) in spine volume in B100 and B200 rats, respectively. B. This trend is recapitulated in thin spine volumes. C. By contrast, B200 rats show selective decreases in mushroom spine volumes relative to B100 and sham groups. K-S, Kolmogrov-Smirnov test, significance set at p < 0.01.
Figure 8
Figure 8
A. Timeline of the second experiment for high dose B treatment (B200) and comparison with groups of rats given a 3-week recovery period (B + Recov) to restore HPA rhythmicity. On day 14 blood was collected in Sham and B + Recov animals to assay for effectiveness of pellet increasing B in levels. On day 35 blood was collected to assay for effectiveness of pellet increasing B levels in B200 animals and in B + Recov to assay for HPA activity restoration. B. B200 and B200 + Recov groups displayed elevated B, and B + Recov rats showed a normalization of adrenocortical function after the cessation of B exposure. N = 6–8 rats per group. *, p < 0.05, significantly different from sham group.
Figure 9
Figure 9
A. Deconvolved images of dendritic segments from pyramidal neurons in PL from different treatment groups. B. Image depicts several layers 2, 3, and 5 dye-filled PL pyramidal neurons (pseudocolored cyan). An atlas plate (lower left) depicts the approximate location and orientation within PL of the dye-filled neurons as shown. Distance in millimeters relative to bregma is indicated. AP, anteroposterior. Scale bar, 5 μm. C. Mean + SEM of dendritic spine density and thin subtype density (D) as a function of experimental treatment. Both B200 and B200 + Recov groups show overall decreases in density relative to sham rats, whereas only B200 rats show significant reductions in overall thin subtypes. E. Mean + SEM of mushroom and stubby (F) spine densities in treatment groups. Both 200B and 200B + Recov groups display evidence of mushroom spine loss at various regions of the dendritic tree, whereas B200 + Recov rats display overall decreases, relative to sham control rats. N = 6–8 rats per group *, p< 0.05, significantly different relative to sham group.
Figure 10
Figure 10
A. Cumulative frequency distributions of overall spine volume in PL neurons reveal leftward shifts (i.e. decrease) in spine volume following B200 treatment, even after a 21-day recovery period. This trend is also evident in thin (B) and mushroom (C) subtypes with respect to sham control rats. K-S, Kolmogrov-Smirnov test, significance set at p < 0.01.
Figure 11
Figure 11
Mean + SEM for dendritic length (A) and number of branch endings (B) after 1 week of exposure to high-dose B (200 mg pellet, s.c.). Mean + SEM for overall (C), thin (D), mushroom (E), and stubby (F) spine densities as a function of B200 or sham pellets. This duration of glucocorticoid exposure failed to induce any frank differences in the dendritic or spine morphologic indices examined in PL neurons. N = 5–6 rats per group.

References

    1. Alfarez DN, De Simoni A, Velzing EH, Bracey E, Joels M, Edwards FA, Krugers HJ. Corticosterone reduces dendritic complexity in developing hippocampal CA1 neurons. Hippocampus. 2009;19(9):828–836. - PubMed
    1. Andela CD, van Haalen FM, Ragnarsson O, Papakokkinou E, Johannsson G, Santos A, Webb SM, Biermasz NR, van der Wee NJ, Pereira AM. MECHANISMS IN ENDOCRINOLOGY: Cushing’s syndrome causes irreversible effects on the human brain: a systematic review of structural and functional magnetic resonance imaging studies. Eur J Endocrinol. 2015;173(1):R1–14. - PubMed
    1. Anderson RM, Birnie AK, Koblesky NK, Romig-Martin SA, Radley JJ. Adrenocortical status predicts the degree of age-related deficits in prefrontal structural plasticity and working memory. The Journal of neuroscience: the official journal of the Society for Neuroscience. 2014;34(25):8387–8397. - PMC - PubMed
    1. Antoni FA. Hypothalamic control of adrenocorticotropin secretion: advances since the discovery of 41-residue corticotropin-releasing factor. Endocr Rev. 1986;7(4):351–378. - PubMed
    1. Arnsten AF, Paspalas CD, Gamo NJ, Yang Y, Wang M. Dynamic Network Connectivity: A new form of neuroplasticity. Trends in cognitive sciences. 2010;14(8):365–375. - PMC - PubMed

Publication types

MeSH terms